Accessibility in Dashboard Design

Welcome to our one off article on inclusive design. In this article we are going to look into inclusive design vs accessible design. What is a dashboard and why is inclusive design so critical in dashboard design? We also take a look at the P.O.U.R Principles, and how they can be used to aid inclusive design thinking.

What is a dashboard? Usually when we think about the word dashboard, we think of the dashboard of a car. Well, that’s exactly what it is. Picture your car’s dashboard. It’s a series of data points brought together in a prominent area of your car, providing you vital information in a hierarchical way. It takes the information a driver needs to see, speed, fuel levels, temperature. Warning lights appear when there is a critical issue with the engine. The dashboard is carefully positioned in the car, it’s at the perfect height to be able to view it without distracting from the road ahead. This has not happened by accident, this is a result of extensive user testing, exploring several scenarios and coming up with the solution that meets the most requirements of the user base. The design for the most part is inclusive, as it has evolved depending on the increasing pool of diverse users. I’m still talking about car dashboards though, why? Well, it’s because dashboards in data visualisation are inspired by car dashboards, yet the same rigorous user experience testing is not applied to dashboards in data visualisation. ‘Well, they don’t really need to be, it’s only data.’ Data is powerful, data can be used to influence critical political, medical, and business decisions. The foundation of data visualisation is about making data accessible, representing it in a meaningful way to inform and drive action. Just as the data points in your car are displayed in an easily accessible way to keep you safe and keep your car running, so should visuals in a data visualisation.  It is worth mentioning at this point that the term ‘dashboard’ is used interchangeably in the data visualisation world, for example, Power BI’s refers to the ability to combine multiple datasets on their Service as a dashboard. For the purposes of this article, my definition of dashboard is an interactive visual representation of data in digital format.

I say data is powerful, it is knowledge. It can prove or disprove hypothesis, support decision making and influence. Making data accessible is at the heart of data visualisation, data in its raw form is unreadable, in order to make it widely accessible, it must be visualised. At this point it is worth noting that data doesn’t just have to be visualised, data can be interpreted through sound and touch, or sound, touch and sight, these are what we call ‘data experiences’. In this article, I will be focusing exclusively on dashboards.  

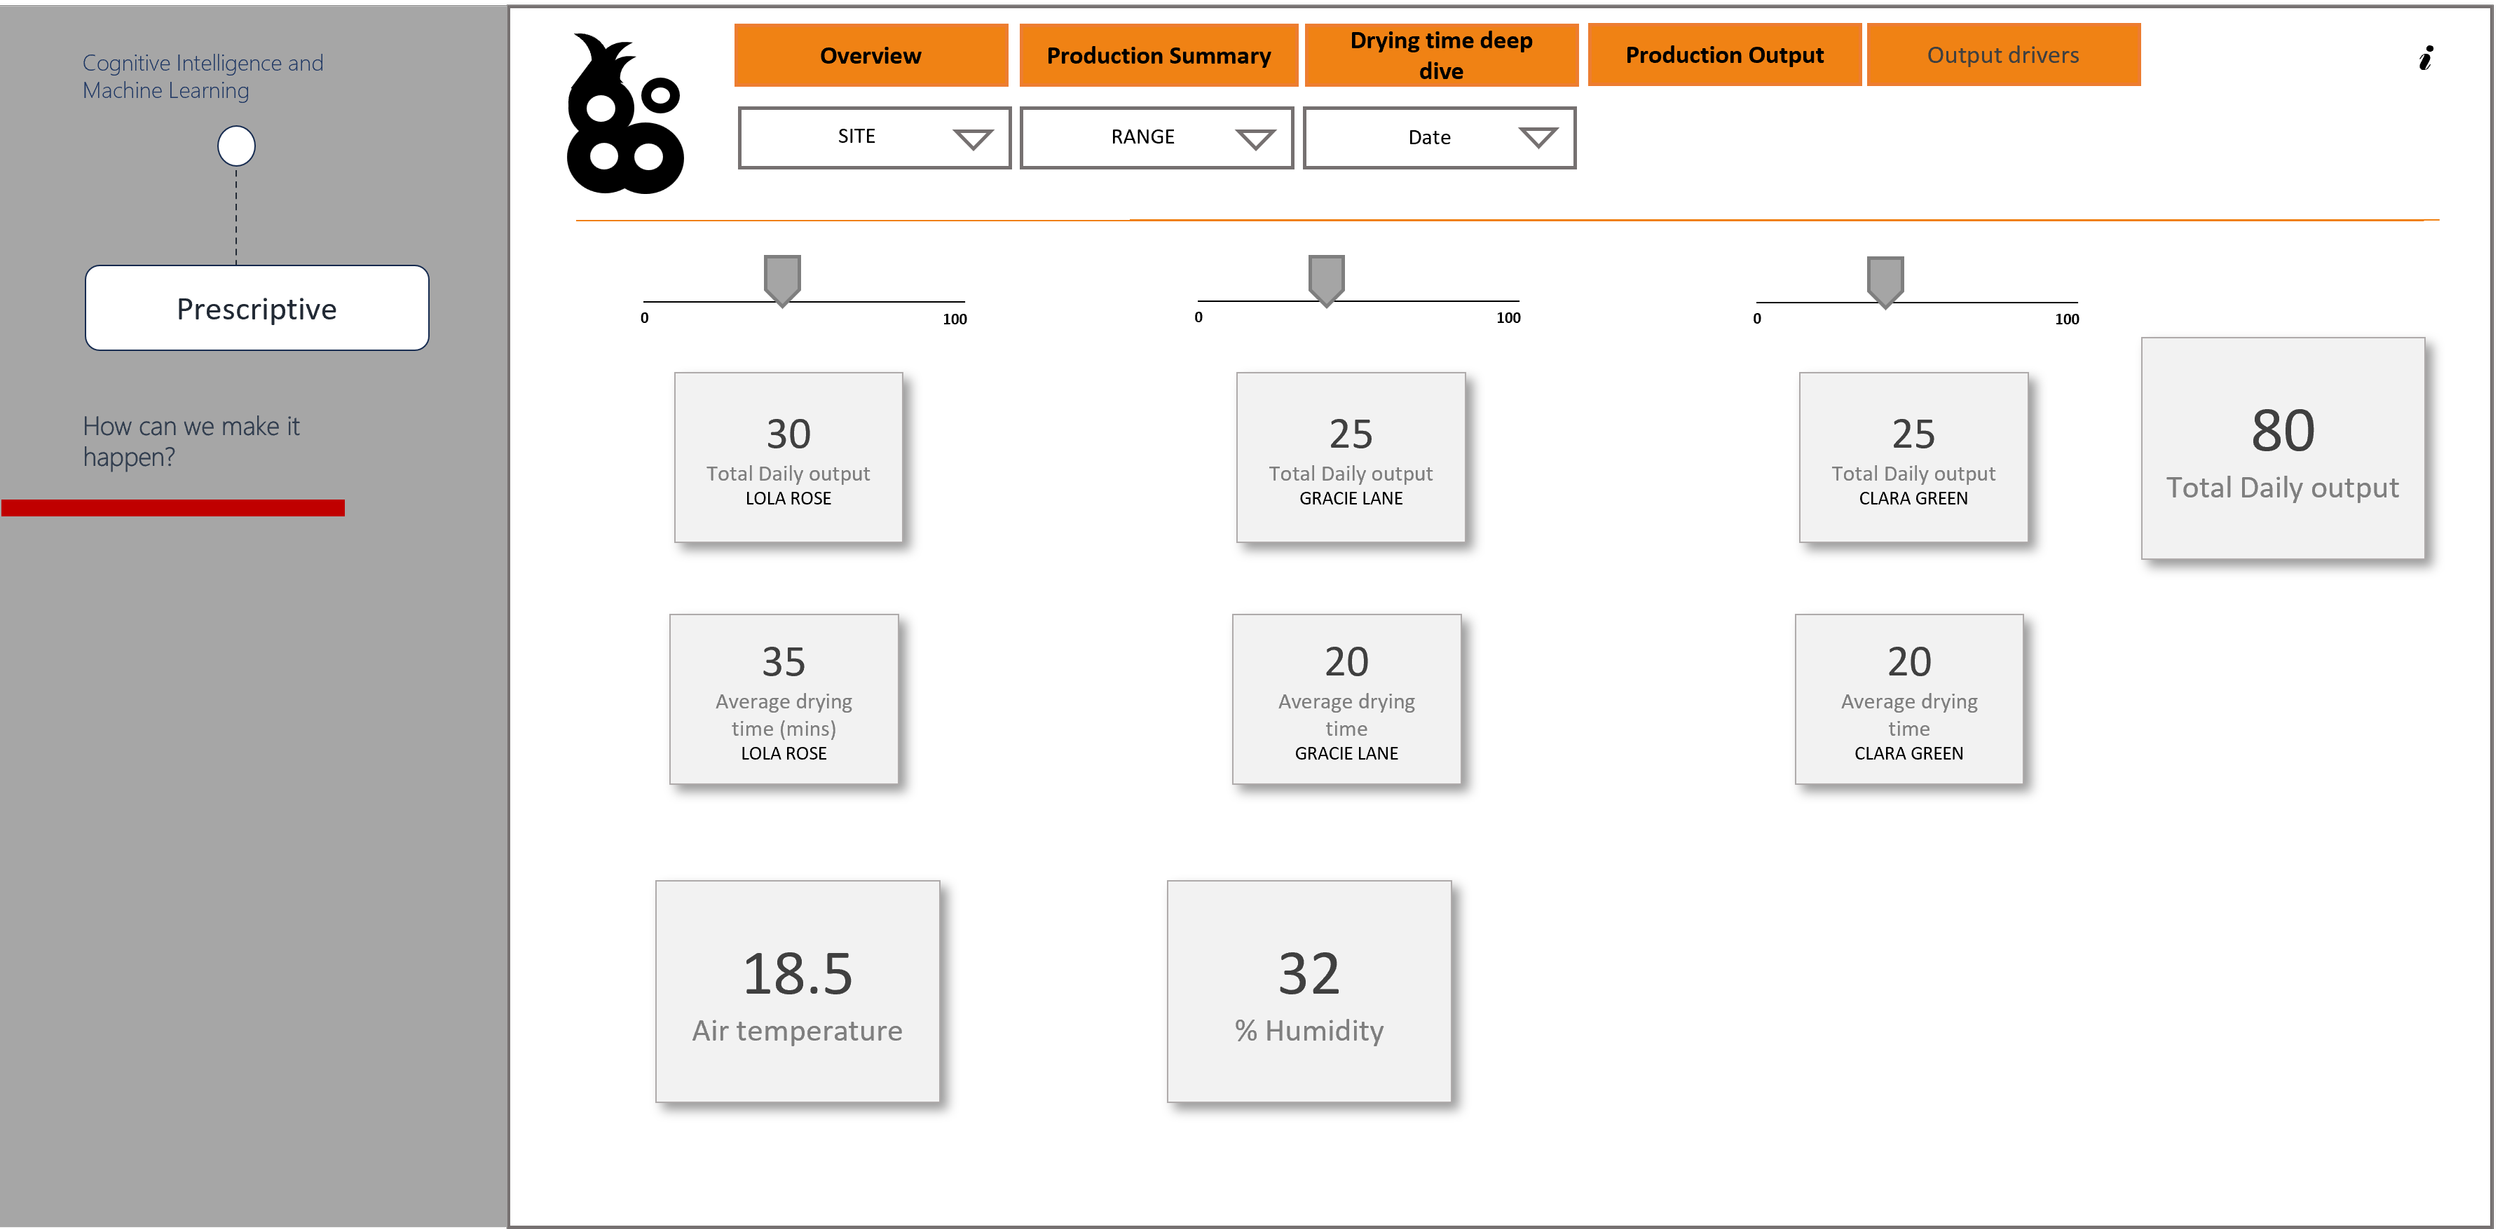
So what are the components of a dashboard? Generally you have around 3 core elements, your branding (including navigation), filters and visuals.   

Below is an example of how a typical dashboard layout looks. 

Why does it look this way? Principally, when we are designing dashboards we follow the principles for website design, but are these rules inclusive? Traditionally, websites are viewed on a desktop or laptop, in the absence of these to view a traditional web layout, the user experience is not the same. It’s made very difficult by the constant scrolling and zooming in and out. Whilst we know that a certain amount of scrolling can’t be avoided, a mobile adaptive layout should be created as an alternative option for users. Inclusive design isn’t just about visual impairment, it covers neurodiversity, physical impairment, mental health, and technical limitation. Notice how I am using the term ‘inclusive design’ as opposed to ‘accessible design’, accessible design calls out differences in users, inclusive design includes all users needs. A good example of inclusive design vs accessible design is a ramp that considers all users needs as opposed to stairs and a lift that silos users based on their needs.  

Web Content Accessibility Guidelines (WCAG2) is developed through W3C, it sets out a series of standards for creating web content that considers the needs of anyone accessing it. Using the P.O.U.R Principles can help navigate the WCAG2 standards to ensure compliance. Let’s take a closer look at the P.O.U.R principles and how we might put it into practice.  

P – Perceivable, this is about ensuring any user can perceive an object. For example, when using icons, ensure 1), they have ALT text and 2), that they are universally identifiable. Users also perceive colour differently, not only due to visual impairments, but neurological conditions such as synaesthesia, which causes the user to see numbers as colours. There are other ways to ensure elements can be perceived by users, such as ensuring high contrast in colours, i.e. black text on a white background. Essentially, each element must be visible to all their senses.  

Above is an example of low contrast vs high contrast. The image on the left is legible to some users, but not all, whilst the image on the right is a much higher contrast and can be read by more users. There are many tools available online that can help when choosing an appropriate colour palette.  

Color Palette by Deque allows you to import your colour palette in to see where they stand against WCAG 2.1 AA colour contrast requirements.  

If you don’t have a colour palette, Accessible Color Palette Generator | WCAG Compliant (venngage.com) will generate a colour palette based on the WCAG 2.1 AA colour contrast requirements.  

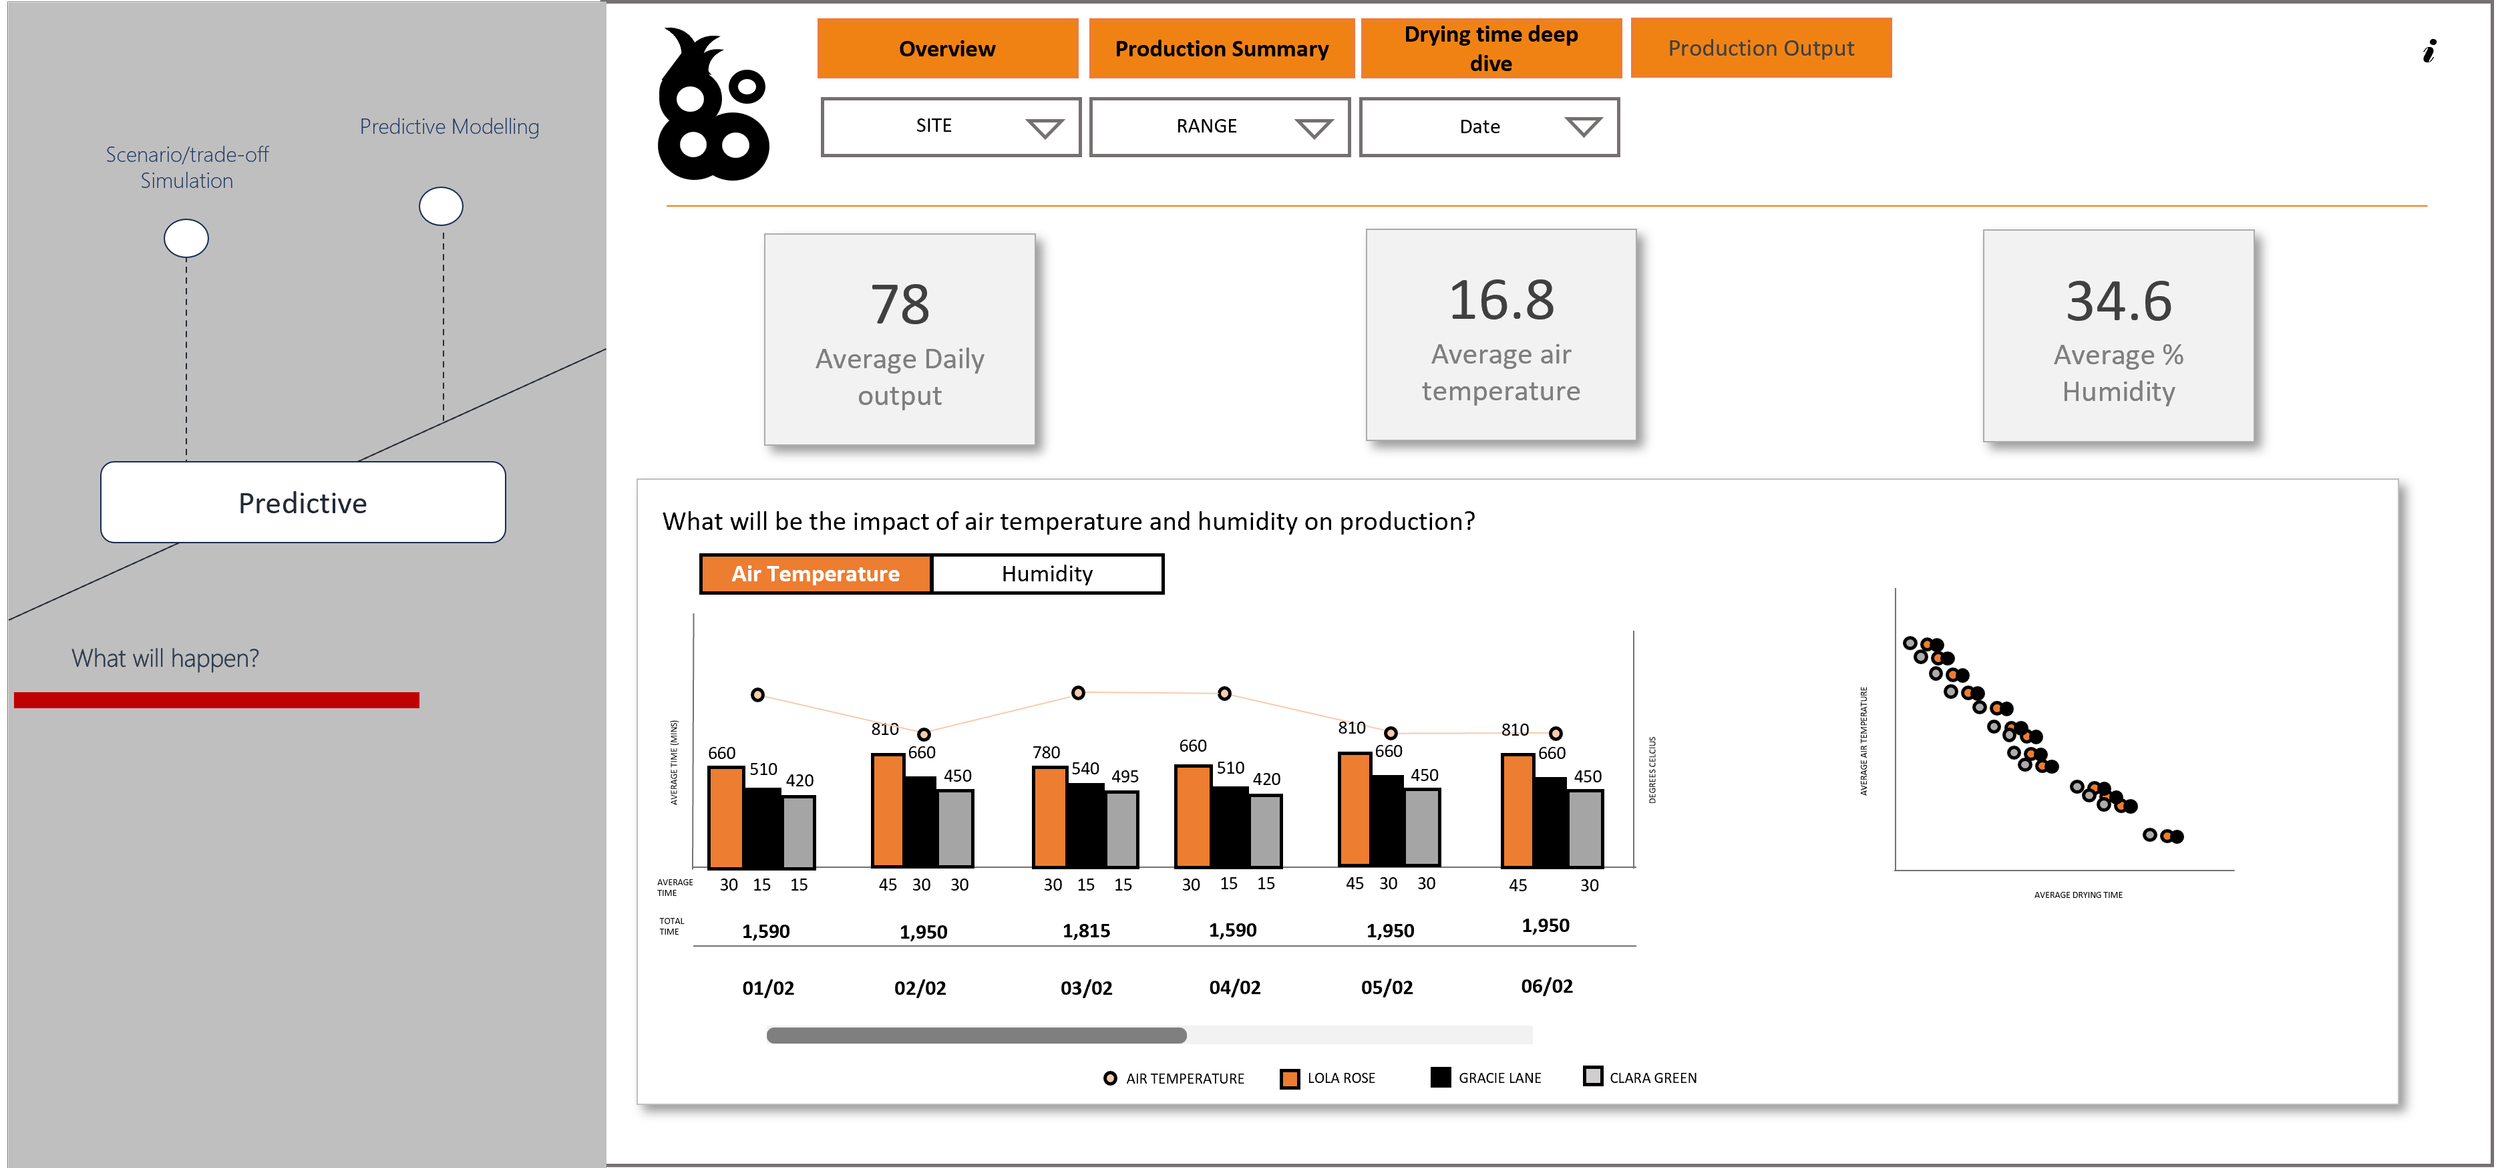
O – Operable, the dashboard must be useable, that sounds like a given, but often that’s not the case. It’s an easy trap to fall into. So much goes into preparing the data to ensure the numbers are correct, that often the front end of the dashboard is neglected. I’ve seen instances where tooltips cannot be picked up by screen readers but are commonly used on dashboards to show additional context. Developers should always test their dashboards to ensure that it makes sense to a screen reader user. Users mustn’t be made to perform an action that isn’t possible for them, for example, clicking a mouse. Dashboards need to be designed to accommodate any screen size. All to often, I’ve seen dashboards being designed and created on wide screens, resulting in users with small screens being unable to access certain features, titles being cut off, filters unavailable. Below is an example of how a dashboard that is developed on a large screen might look if the user tries to access it on a smaller screen.

Inclusive design isn’t just about a user’s personal limitations when it comes to using tech, it’s also their technical limitations, be that their own technical ability or the agent they have available. A dashboard must be intuitive for users with technical limitations. Often dashboard layouts will emulate a website as most users are familiar with websites and for the most part find them easy to navigate. There are some basic rules you can follow to ensure that your dashboard is intuitive. If you are building a dashboard for an organisation that has existing systems, where possible align the branding and layout to those systems as users will be familiar with the layout. Consider the information hierarchy, moving from the highest level of information to the more granular. In the West we read from left to right, therefore the most important information should be top left and flow down to the bottom right. This is essential when deciding the information hierarchy for your dashboard. The tab order is read by a screen reader and must replicate what is visually presented on screen.  

U – Understandable, how is this different from perceivable? In the context of a dashboard, it’s about making sure the visual itself can be understood as opposed to just being seen. Is it labelled correctly? Is it in a sensible position, next to related elements? Is it using the correct and the simplest chart type? Data art where data is visualised in beautiful, complicated graphics are very impactful, but some examples of it are not very accessible, complicated visuals are not easy to understand. Animated visuals can also be difficult for users with limited technology as it may not render correctly. Ultimately, dashboards are used in decision making, the information can’t be misleading. It’s important to select the right chart when creating a dashboard. The diagram below will guide you to choosing the right chart.  

The correct chart selection also applies to the next principle, R – Robust. Users should be able to access the content as technologies advance, so visualisations that are not company approved are not recommended. All the content in a dashboard should be available through any user agent, including assistive technologies. This means as technology advances, content is still accessible. If we look to a very old school example, Adobe Flash. It was used to create multimedia such as interactive animations to be embedded on websites. Anything created in Adobe Flash required a browser to have a Flash player, but as mobile adaptive grew, screen sizes changed, so too did internet browsers, and they could no longer support flash players, therefore anything being built in Flash was not supported, Flash elements were designed for large computer screens, they weren’t suitable for mobile devices. Security was also an issue, with Flash player being repeatedly hacked. Adobe has now officially stopped supporting Flash in 2021 and has blocked Flash content from running in Flash Player. Web browsers have removed all Flash-related software. So how do you ensure your dashboard is robust? Firstly, consider what agents the dashboard is going to be viewed on, does it support your dashboard in terms of the type of media you are using? Not all agents will support animated charts, therefore it is best to avoid them. Images should be used sparingly, as they might not fit in every screen, they can also slow load times, especially on mobile devices. Ultimately it is about ensuring that no one is left behind as technology advances. Tools like Power BI give the option of creating a dashboard in a mobile view as well as a desktop view. This allows the user to access a mobile adaptive view and a desktop view depending on the agent they are using.  

There are many online tools and resources that can help a BI developer ensure their dashboard is accessible. It is worth noting that most of these resources focus on web, mobile app, and general UI design. There will be extra considerations in a dashboard around choice of chart type, labelling of charts, filters, and other features such as export to Excel. Extensive user testing with a diverse group of users will establish user needs around chart functionality and the information they need to access. User testing will need to be done from two lenses, persona based, how does the user interact with the tool, for example, how do they want to navigate it, what functionality do they need? Role based, which will not often be used in traditional UX design, dictates what information is available within the dashboard and in what order. The WAVE tool is an extension available in all Browsers and helps identify accessibility issues on a web application to ensure inclusive design. Whilst the WAVE tool will help identify issues, it is up to the developer to be familiar with accessibility requirements and identify and correct them. The example below shows what happens when I ran the WAVE tool on a website. It scans the webpage for accessibility issues and provides a summary of the issues that allows you to drill in and view the details. The WAVE tool will advise on things like missing ALT tags, contrast issues, tab order issues. It sorts issues into six categories: Errors, Contrast Errors, Alerts, Features, Structural elements and ARIA. Let’s look more closely at what each of those categories mean. Errors indicate issues that will impact certain users and where there is a failure to meet WCAG. Contrast Errors are when text fails to meet WCAG standards. Alerts are elements that may cause issues, developers need to decide for themselves if these are issues. This is where a knowledge of your user’s needs is essential. Features are elements that could be implemented to improve accessibility. Structural elements identifies hidden elements in the HTML and indicates any nesting of elements. ARIA is a W3C specification that stands for “Accessible Rich Internet Applications.” It consists of markup that can be added to HTML in order to communicate the roles, states, and properties of user interface elements to assistive technologies (AT). This category identifies where ARIA is being used in a website.  

WAVE is a very useful tool, as it gives a BI developer a good indication of where possible accessibility issues exists. It is worth noting that it is aimed at web developers, however I would still recommend running your dashboard through the tool once it is published. The WAVE tool combined with your own knowledge of inclusive design will ensure that your dashboard is inclusive of all user needs.  

Inclusive design is never a ‘nice to have’. Our world is diverse, but often designs are not reflective of that because they haven’t considered all user’s needs. This has resulted in products and services being out of user’s reach. This is simply not acceptable. More and more our world is becoming data driven. Data accessibility is critical. Inclusive design is essential. This guide will help with the basic requirements for inclusive design, but for more in depth requirements, it’s essential to carry out extensive requirements gathering before beginning development and testing every iteration at intervals with your users. As a BI developer, it is vital to have inclusive design at the forefront of your mind when developing a dashboard so no user is left behind.  

Prescriptive Analytics – Outputs, levers and drivers

Welcome to the final part of our five part series on the Analytics Maturity Model. If you missed the last parts of this series, you can find them here.

Over the last number of weeks we have been exploring the Analytics Maturity Model. This is a roadmap for organisations to get to know their data and ultimately become insight driven. The stages of the journey are shown below. This week we are going to look at the last stage of the journey, Prescriptive Analytics, what are the elements you need to tweak to generate a certain outcome?

We have been following a manufacturing company on their analytics journey. They noticed that output was low on certain days, and have been working to find out the reasons behind it, and what they can do about it. They have started their journey by defining their metrics, captured their data, visualised it, identified the current issues, why they have happened and even predicted what will happen in the future depending on the weather conditions. What do they do with that information? They take action, but what action do they take? Again, organisations may know the answer to this anecdotally, but a prescriptive model will take all the data available and provide outcomes based on scenarios. I have often heard this described as ‘Outputs, levers and drivers’. Drivers are the factors in this example. In this case, materials and weather conditions, the two things that remain unchanged in the sense that they cannot be controlled. The levers are the elements that can be controlled, such as temperature and humidity, named as such as they can be controlled. The outputs are just that, they are the result of pulling the levers on the drivers, which in this case are drying times and production output.  

How does this work in practice? To get to this stage, a predictive model would need to be in place, it will predict outcomes and scenarios based on the data it has been fed, but the user will have the ability to tweak the scenario to find the best possible outcome, which will feed into the solution. Let’s look at this using our example; our company needs to know how to create the conditions to ensure that drying times are consistent across all materials, resulting in no change in production output, regardless of the weather conditions. Machine-learning algorithms will parse through data using ‘if’ and ‘else’ statements to explore scenarios and make recommendations. These recommendations are then verified by the production team, and strategies are put in place to ensure production is unaffected by the weather conditions. This is the perfect blend of technology and business knowledge.  The example below shows what this might look like. A Production Supervisor can use the toggles to select the desired output and the model advises what the desired air temperature and humidity should be.

Technology is amazing, but technology alone wouldn’t be half as impactful without the business knowledge to see it through to practical application. At Endeavour, we leverage the blend of technology and business knowledge. Our deep understanding of Microsoft technologies alongside the business application has proved invaluable to our clients, transforming their businesses and saving them money. We have worked with a number of organisations at varying stages of analytics maturity, providing services from infrastructure to AI whilst growing our own diverse business knowledge. We understand the challenges organisations face on the path to becoming insight driven. Data definitions can be difficult to align on. Knowing what infrastructure, you need in place to capture data efficiently and consistently while keeping costs low can be difficult to navigate. Adoption of new systems within an organisation can be difficult. Our experts at Endeavour are Microsoft certified along with several years of experience with organisations helping them navigate their analytics journeys. If you’re not sure how to get started on your analytics journey, why not get in touch with the team at Endeavour? We offer a free, no obligation consultation to help us get to know your organisation and help your understanding of what is involved in becoming insight driven. 

Predictive Analytics – Hindsight is a wonderful thing

Welcome to part four of our five part series, if you missed the last parts of this series, you can find them here.

Experience is so valuable in business. Much like our own expertise at Endeavour, the more clients we work with from different sectors and the more diverse the issues are, the more we grow our own expertise and can quickly identify solutions to clients. The more experience we have, the more knowledge we have. The exact same can be said for predictive analysis. No one can look into the future, but we can use our past experience to help navigate the impact of future events. COVID took us by surprise, we had never experienced a global pandemic to that degree. There was very little data available to help predict the impact of the devastation COVID caused. But with all the data gathered at the time and following, we will be better equipped to make decisions should another pandemic arise.  

Let’s go back to the example we have been using in this series. The Production Supervisor has come back to the Head of Production with a correlation between drying times and humidity, they have the hypothesis that on humid days, output is lower because drying times are slower as there is more moisture in the air. In order to test that hypothesis, data will have to be captured over time to understand what happens to production in certain weather conditions. This historical data can then be input into a predictive model which can be used to indicate the impact of weather conditions on production, which in turn can provide the business with the ability to take action on the days where humidity is high.  

So how does predictive analysis work in practice? It starts with a hypothesis, in this instance it’s; ‘humidity has an impact on production.’ The analysis needs to determine if weather conditions is a factor in production. The business will need data captured over time, this data will need to be cleaned and prepared to be fed into a predictive analytics model. Since we are looking at the relationship between variables, the data will be fed through a regression analysis model. If we wanted to look at this on an individual basis, i.e. by product, we might consider using a decision tree, as different materials might respond differently to weather conditions, therefore resulting in a different outcome. These models can be trained over time to add in more scenarios and for more accurate predictions as more data is captured.  

Predictive analytics has a number of uses, from fraud detection, operational improvement and customer segmentation. It is a very powerful tool, but it requires a strong foundation of accurate, well governed data capture, and a strong organisational culture of analytical best practices. Similar to how our bad experiences can make us biased, bad data and bad analytical practices can make predictive models biased. Our experts at Endeavour recognise these potential pitfalls when it comes to predictive models and work with our clients to ensure they have the correct foundations in place in order to get the most accurate predictions.  

Make sure to check back this time next week when we take the final step in our journey and look at Prescriptive Analytics.

Diagnostic Analytics – Context is Key

Welcome to part three of our five part series on the Analytics Maturity Model. If you missed the last parts of this series, you can find them here.

In this series we have been exploring the Analytics Maturity Model. The model details the various steps organisations go through to get to know their data better and ultimately become insight driven. Last week we looked at the ‘what happened’ through Descriptive Analytics and explored a potential scenario with a manufacturing company. This week we continue our journey and discover the ‘why’ behind the numbers.

Now that the organisation has established ‘what has happened’, it’s time to understand ‘why has it happened’ so that it can start to feed into the business decisions. In the previous article, I described a manufacturing company faced with the business question of; ‘why is output down?’. The business decided to investigate by capturing data on what was happening during the stages of production, as seemingly, nothing had changed from previous weeks. The first step was to look at the metrics they were capturing, apply the business logic and ensure that they were capturing the data in a consistent manner by using the correct tooling. By looking at all the production variables over the space of time, they were able to see that drying times were elevated on certain days which was having an impact on output. There is an insight, but what is the business action that can be taken on the back of that? Essentially, what is the ‘so what?’ This insight provides the first step to understanding the ‘so what’ and move into the diagnostic phase of ‘why is this happening?’.  

At this stage the collaboration of business knowledge and data is very powerful. That rich context that can provide an explanation as to why certain events are happening, backed up by accurate data can enable deeper understanding and empower organisations to make informed decisions. Tools like Power BI offer collaboration features, not just to share insights, but to provide business context through commentary. Power BI’s comment functionality allows users to discuss insights on the visuals. Let’s look at this in the context of our example. The Production Supervisor shares the visual that shows the correlation between low output and slower drying times with the Head of Production.  

The Head of Production advises the Production Supervisor investigates the drying conditions and overlay data on air temperature and humidity. Using the standards and methods applied in the previous steps to establish ‘what is happening’, the Production Supervisor can overlay data on air temperature and humidity to establish ‘why is this happening’. Since consistent data capture is now an established practice in the organisation, joining datasets is seamless. The Production Supervisor can join datasets together using Power BI Service to create a dashboard to layer on context. They discover that an increase in humidity is the potential cause of slower drying times, this is something that will need to be looked at over time to establish if this is a trend and what action should be taken. This comes later in the maturity journey.  

Last week I showed an example of what Descriptive Analytics might look like in a Power BI report. Below is an example of what a Power BI report could look like when we start to look at the ‘why’. We can clearly see the potential why alongside the slower drying times. On days where production is lower, air temperature is lower and humidity is higher.

Context is key, creating that fuller picture in data allows organisations to discover the reasons behind why certain events are happening and brings them closer to data driven decision making.  

Our experts at Endeavour have helped many organisations across numerous sectors bring their data together using Power BI to contextualise their insights, unlocking answers to complex business questions.  

Our journey continues this time next week, tune in to find out how the power of trends can help predict the future when we look at Predictive Analytics.

Descriptive Analytics – The first step to becoming insight driven

Welcome to part two of our five part series on the Analytics Maturity Model. If you missed the last part of this series, you can find it here.

Last week I introduced the Analytics Maturity Model which maps the stages of a company’s experience as they progress through a journey of understanding of their data. The model has four stages: Descriptive Analytics, what happened? Diagnostic Analytics, why has it happened? Predictive Analytics, what will happen? Prescriptive Analytics, how can we make it happen? This week we’re going to look at the first stage of this journey, Descriptive Analytics.

‘What happened?’ Simple question, right? No, not always. If there is no accurate data captured on an event, there is no way of knowing what happened. We may know anecdotally what happened based on experience, but small, but crucial details may go unacknowledged.  

Let’s look at a possible scenario; you own a company, you notice that output is lower than usual. All the variables that are measured are seemingly the same, materials, resources, timings, but for some reason, output is lower than usual. Why is this the case? It turns out with a closer investigation of timings by gathering accurate data on it that drying times are taking longer than usual. This has now highlighted an issue with drying times, which can be investigated further.  

So, what does that closer investigation look like? I said that timing is something that is measured. Timing is a metric, as it is something that needs to be measured to understand the production process, but what does timings mean to the organisation? This is where it is essential to understand from the business the exact definition of that metric. In this instance, one area of the business might have said that timing is not longer, as clear start and end points have not been defined, therefore no investigation pathway is opened and the low output may remain an issue for a long period of time. This could result in a loss of revenue and unsatisfied customers.  

Now that the metric definition is established, the next stage is looking to capture the data in an accurate and consistent way. This ensures that the correct foundations are laid in order to layer on that richer context to help discover why drying times were longer than before. So, in the example of our manufacturing company, in order to begin the investigation into the longer drying times, they first need to align on a number of things, at what stage does the drying process start? When does it end? Is drying time to be captured per item for the same item? What is the recommended drying time? These questions help define the metric and how it will be captured and calculated. It is a critical step in Descriptive Analytics. The image below shows what this might look like in a dashboard. We can see output, man hours and drying time, this dashboard describes what has happened in production.

Descriptive Analytics provides a narrative of events. It highlights the areas that need immediate attention. Therefore, it needs to be handled with care. That narrative needs to be the single source of truth. It needs to reflect the correct business logic. Alignment on definitions in the business is critical. The data capture needs to be accurate and consistent. Use of the correct tooling to capture data can help mitigate risk and error and ultimately ensure an output of reliable data.  

Metric definition and data capture is the first step, but data in its raw form is not very accessible. This is where tools like Power BI can help, by taking data from its source and transforming it into a readable format. So, when we go back to our example of the drying times, the Production Supervisor will be able to share a visual with the Head of Production that shows the correlation between drying times and lower output. The Head of Production will be able to look at this and advise on next steps.  

Descriptive Analytics provides a view of what happened. This alone can be very powerful as it gives 360° insight and signposts the areas of further investigation. At Endeavour, we help organisations explore the possibilities of analytics by empowering them to enrich their data with their expert business knowledge and help them get to know their data.  

This week we’ve look at the ‘what happened?’. Don’t forget to check in this time next week where I go to the next step of our journey and start to look at uncovering the ‘why’ behind our data through Diagnostic Analytics.

Analytics Maturity Model – Navigating your data journey

Welcome to the first of five articles on the Analytics Maturity Model.

Organisations will often say ‘I want to become more insight driven, but I don’t know where to start.’ Like any journey, it starts with the first step. Not necessarily where are you stepping to, but where you are stepping from. That will determine what the rest of the journey looks like.  

What is the benefit of being insight driven? ‘It’s always been done that way’ is a popular justification for some of the business-critical decisions, but what is the danger of this? Organisations know their businesses inside out, but what if there was a way for them to have a clearer view of what is happening? Why is it happening? What might happen in the future? and how to control what will happen in the future? Sometimes there are blind spots, areas where efficiencies can be made that go unnoticed, but they might be having a massive impact on the bottom line. Having a 360° view has been proven to reap massive benefits for organisations.  

Often organisations can face issues such as a lack of the correct infrastructure needed to capture and analyse data correctly. This is seemingly a costly exercise, however the cost of not investing in analytics can far exceed the cost of investment in infrastructure.  

The Analytics Maturity Model maps out what the journey to becoming insight driven looks like. At Endeavour, we know that journey is unique to every business, but this is the broad model to helping organisations become empowered to make more complex business decisions.  

The Analytics Maturity model showing the four stages of the model. Descriptive Analytics, Diagnostic Analytics, Predictive Analytics and Prescriptive Analytics.

The first step in any organisations analytical journey is working out ‘what happened?’. An example of this is ‘what were my sales this week?’ This provides the core foundation to understanding where the fires are, what needs immediate attention? This stage is around understanding your data, therefore it requires the most care when setting up your data capture methods, aligning on metrics and establishing their definition. This solid foundation of analytical best practice allows for adding the next layer of analysis and help organisations to understand ‘why did this happen?’ Are there any trends? What is the wider context? So, ‘why were my sales low this week?’ This can only be achieved with the right foundation in place. Ensuring that sales data is captured correctly and the definition of ‘sales’ is defined. The next layer to this is understanding ‘what will happen’, when organisations have a view of certain trends, i.e. what is the potential impact on sales during adverse weather? Having historical sales data alongside weather statistics allows a view of a correlation between the two metrics, this in turn can give a view of what might happen to sales in a storm, or in a heatwave and allow stock levels to be adjusted accordingly to avoid waste. That leads to the next layer of how much I need to adjust stock levels by to ensure waste is minimised depending on the weather conditions.  

At Endeavour, we have helped numerous organisations at varying stages of their analytics Journey. We understand the value of the rich industry and business knowledge when it comes to laying the foundation of the pathway to become insight driven. We collaborate with organisations to embed that knowledge at the heart of business decisions alongside accurate and meaningful data.  

Join me this time next week, when I’ll be taking you on the first step of the Analytics Maturity Model journey by diving into Descriptive Analytics and looking at how it can be applied to a real life example.

Re-Certification of Cyber Essentials Plus

In addition to our core Cyber Essentials re-certification back in May, we are pleased to announce that the renewal of our Cyber Essentials Plus has also been confirmed today after a successful review and testing from our external assessor.

Many thanks and congratulations to our managed services team for all of their continuous hard work in this area, ensuring that we practice what we preach to our customers and part of our overall approach to keeping our own applications and systems safe and compliant against the latest cybersecurity threats.

A great job, well done and keep up the good work!

Verification Link is shown below: https://registry.blockmarktech.com/certificates/3824ab32-7b83-485a-9040-e5d5068398fc/?share_key=POwU5sSWHr3tpMHmhZ0YpS45J8Q4guRHk6AE2IKEChg

Fending off the January Blues...

Today is Blue Monday, the date in January that considers factors including the average time for New Year's resolutions to fail, the bad weather to set in, and the credit card statement coming in from all that Christmas spending. 

Therefore, in order to combat such a miserable day, we have brought the team some treats from Benningtons Bakery to help counter those post-holiday blues.

Living Wage Employer Accreditation Achieved!

I am delighted and proud to announce that Endeavour is now an accredited Living Wage Employer!  

The real Living Wage is higher than the government’s minimum, or National Living Wage, and is an independently calculated hourly rate of pay that is based on the actual cost of living. It is calculated each year and is announced by the Living Wage Foundation as part of Living Wage Week. It is currently £10.90 in the UK, with a higher rate of £11.95 for London, reflecting the higher costs of living in the capital.

We are really proud of this commitment, as we voluntarily choose to pay the real Living Wage because we believe that a hard day’s work deserves a fair day’s pay.  You can find out more about the Living Wage by visiting www.livingwage.org.uk.

What’s coming in Dynamics 365 Release Wave 2 for Marketing & Customer Service

Microsoft have recently released the Microsoft Dynamics 365 & Power Platform 2022 Release Wave 2. This document shows the new features and improvements to the platform that will be released to the public between October 1st 2022 and March 2023

In this post we will be focusing on some of the new features and enhancements which are being rolled out for the Marketing & Customer Service modules of the Dynamics 365 Plarform.

What is Dynamics 365 Marketing?

Dynamics 365 Marketing provides real-time customer journeys to enable you to highly personalised experiences to your customers and prospects across the entire buying process of your products and services.

It also provides intuitive lead capture forms that can be integrated into exiting website and e-marketing platforms, automatically drive lead nurturing with Microsoft-powered AI, and provides clear analytics dashboards and reporting that helps provide better alignment between sales and marketing efforts and integrated into the same Microsoft 365 platform you know and trust.

All of this combined allows you to confidently grow your marketing and customer experience efforts to existing as well as a wider range of potential customers each month safe in the knowledge that you can keep track and progress sales leads automatically.

Make incremental updates and optimize journeys while analysing all past versions

As we all know the backbone of Microsoft Dynamics 365 marketing is the customer journey and automation this provides in the overall campaign. You will be glad to hear that Microsoft is releasing functionality to make it simpler, safer, and faster to make minor tweaks and changes to marketing campaigns that are currently live.

Coming in Release wave 2 2022 Microsoft are adding the following features to marketing journeys:

  • Make easy edits to live customer journeys.

  • Automatic version control to compare to past versions if rolling back changes is required.

  • Collaboration between team members through change tracking and notes for each change made to the process.

Send reminders within journeys to drive customer actions (coming January 2023)

Microsoft Have also recognised the need for reminder functionality within customer journeys. It has been a long-requested item as users previously had to create their own logic using power automate or workflows for reminders.

Moving forward Microsoft has added a reminder process step to the customer journey which can be used to automatically follow up with campaign participants. An example of this could be that a customer followed a link through to your website and looked at some specific products but clicked off the form. Three days later the campaign could offer them a discount for the products they viewed without user interaction.

The follow-up process can be stopped in the following ways:

  • A user journey participant performing a certain action.

  • A specified date & time is reached.

  • X number of reminders issued.

Target the right audience using the new segment builder

Following the trend seen in other areas of the release wave Microsoft are again aiming to remove the complexity and knowledge required to use their business applications. With this aim they have redesigned the segment builder.

With the new Dynamics 365 Marketing segment builder, you can build segments by describing them in natural language or by using the easy drag-and-drop logic builder that doesn’t require specialized knowledge of complex data structures and logical operators.


What is Dynamics 365 Customer Service?

Dynamics 365 Customer Service is an end-to-end solution for any organisation that offers customer support for its products and/or services. Its scope covers everything from self- and assisted-service scenarios down to complex multiple customer and 3rd party supplier engagement.

Customer Service provides comprehensive and efficient case routing and management for all types of call, a knowledge base where users can author and consume knowledge articles, and robust insights through AI suggestions, automated case progression and esclation with easy to use workflow tools and while offering managers and owners a wide array of embedded performance reporting and analytics to keep track of everything.

With recent updates it now also provides add-ons for omnichannel engagement through chat, social channels, and can be integrated into phone solutions such as Microsoft Voice to record calls and create transcripts that will highlight actions to and follow up to be taken as well as provide insights into how the oepration and customer interacted with sentiment analysis.

Timeline Customisation

Within the new release Microsoft are enabling the ability for the Customer Service timeline to be customised to show only the interactions that are required for the snapshot view.

Enhancements to the Dynamics 365 timeline maker experience include the following capabilities:

  • Configure which actions are shown for each type of record.

  • Configure and show more than one timeline on a form.

  • Create and view each type of activity with main form dialog, main form, or when applicable, quick view.

  • Create and view fax and letter records on the timeline are disabled by default.

Enhancements to Customer Support Swarming for Complex Cases

Microsoft are continuing to lean into the integrations with Microsoft Teams and have continued to update the swarming feature for cases within Dynamics 365. Swarming allows case workers to find teammates skilled in the issue at hand and provide a swift resolution to the customer.

The enhancements this release wave are as follows:

  • Richer agent experience with improved swarm creation flow, ability to create notes and tasks to manage swarm progress, and enhanced wrap-up activities.

  • Streamlined admin experience for a faster setup. Admins also have increased flexibility to define which CRM users can automatically be added as participants to specific swarms.

  • Organisations can have additional CRM users beyond the existing default users. Roles such as the agent’s manager, account owner, and Team admin are available in the current release.

Route work items to Preferred Agents

Microsoft are no strangers to ensuring customers have the best customer experience and although there are many factors to this Microsoft area adding functionality to send specified customers to their preferred service agent if they are avaible.

With the proposed feature, the administrators will be able to do the following:

  • Set up the preferred agents for customers.

  • Configure their organization to assign work to the preferred agent if available.

  • Select the assignment logic if the preferred agent is unavailable.


Want to find out more about Microsoft Dynamics 365?

We have barely scratched the surface of the power Microsoft Dynamics 365 can offer any type of size of organisation.

So, for more information on how the Dynamics 365 platform can transform your business processes, to save time, costs and increase growth contact our solutions team at solutions@endeavour-is.com to setup a free consultation and demo.

Dual Cyber Essentials Awards for Endeavour

Endeavour is pleased to announce our certification of Cyber Essentials and Cyber Essentials Plus across the whole organisation. Not that security isn’t an essential priority for our own or client systems, far from it, we have a strong track record in providing security focused solutions over the years, as well as helping some of our clients meet these industry recognised standards at the same time.

Therefore, it is great to finally get independently certified confirmation that our policies, procedures, as well as a physical review of our technology and systems, has all come back with a positive result for our own organisation. Such certifications give potential customers additional confidence that you take security seriously within your business, not to mention that a more increasing rate of public and private sector contracts now ask for such standards as a prerequisite.

However, like all compliance, getting the certification is only the start of a continuous process going forward. Not only to maintain this level of certification but more importantly to regularly review and adapt our systems to the ever growing list of new threats and risks that every business today has to face.


All of this evolving knowledge and best practice is passed onto our clients as it has done over the years, and in most cases that will be enough for some of our clients. However, if you are interested in getting your business certified to this standard, please do not hesitate to get in touch, and we will be more that happy go over the requirements and steps involved in more detail.

Useful links:

Dynamics 365 & Power Platform Release 2022 Wave 2

Microsoft have recently released the Microsoft Dynamics 365 & Power Platform 2022 Release Wave 2. This document shows the new features and improvements to the platform that will be released to the public between October 1st 2022 and March 2023.

 In this post we will be focusing on the new features and enhancements which are being rolled out for all Model Driven Applications & Power Platform in general.

Multi Entity Forms

The implementation of Multi Entity forms is one of the features that we are most excited about as this has been a long-awaited request from the community. This feature works similarly to the quick view but will allow the embedded related entity to be edited. The example below shows an account form with a related contact embedded in it.  The main difference this has from a quick view is that the contact information can be edited without the need to switch screens.

Teams Integration Enhancement

Microsoft have also been working on the Teams integration seen in recent waves. Currently this requires some settings to be tweaked and is only available in certain model driven applications. In this release wave this will be available for all model driven apps within the Power Platform. This will enhance the Dynamics 365 users’ ability to collaborate and reach the people they need in order to progress leads, opportunities, cases, or meetings with a single interface.

 Power BI Quick Reports in Model Driven Apps

In Release Wave 2 Microsoft have now included Power BI “Quick Reports” in model driven applications. This feature allows users to take their current view within Dynamics 365 and quickly visualise this data in a Power BI report. The users will then be able to manipulate this view by changing the visualisations, filters, and data to fit their needs. Once the user closes the view the changes are not permanent, and the report will be reset to its default state. This update will allow users within Dynamics 365 who are not Power BI report developers to create quick one-off reports and reduce lead time for information gathering.

View Users’ Presence

Along with the new improvements to the Microsoft Teams integration with Dynamics 365 Model driven apps, Microsoft have also now implemented activity status icons, like Teams. This is a small icon that will show if the user is Available, Busy, Away, Do Not Disturb, or Offline within the organisation. This feature will increase collaboration and ensure information is sent to the appropriate users who are available to work on it.

What’s new and planned for Power BI

Microsoft recently announced the planned feature releases for Power BI from October 2022 through March 2023 and includes changes for both Power BI Premium and Power BI Pro users to enjoy!

For Power BI Premium users, typically enterprise users, the new features include performance and security improvements.

For Power BI Pro users, the new features are focussed on the end-user experience and include more flexibility and design options for creating mobile-friendly reports, and a new Power Query Diagram view in Power BI Desktop which provides an more user-friendly interface to prepare, transform and visualise data.

If you’re interested in taking a more in-depth look at the new features as well as the dates that they will become available, check out the Microsoft Docs at https://docs.microsoft.com/en-us/power-platform-release-plan/2022wave2/power-bi/planned-features

Endeavour awarded fifth Microsoft Silver Competency

This is the first post of 2022 about our Microsoft competencies but since the previous post, we've increased our collection to include Communications.

Microsoft gold competencies are awarded to partners who demonstrate their technical excellence in, and best in class capability within, a Microsoft technology area.

Microsoft silver competencies are the stepping stones to gold competencies and demonstrate consistent capability and commitment in a Microsoft solution area.

Endeavour now holds 9 Gold competencies and 5 Silver competencies, thanks to our team for attaining the required Microsoft Exams that are required to attain and retain these.

As a cloud-first focused Microsoft Partner, we are extremely proud of our technical achievements and we hope that being awarded these competencies assures our current and future customers of our technical competence to deliver scalable solutions, deployed using a wide range of Microsoft cloud-based solutions that help meet compliance requirements, replace complex and costly legacy systems and give them the necessary advantage in the current mobile-first, cloud-first world.

Meeting the challenges of software licensing changes coming to Non-Profit organisations from Microsoft in March 2022

Software licensing and compliance in this area can be difficult to understand, let alone hard to keep maintained.  Especially when that licensing is for Microsoft products and services, which even experienced IT professionals can view as a complicated mix of rules and conditions depending on the type of organisation you are, the type of license you need, and the purchase method undertaken, and comparable to learning a new language the day before you go on holiday.   

So, with that in mind, depending on how and when you purchase your Microsoft software the rules and typical costs for that licensing will change by 24 March 2022, when Microsoft will have implemented a global increase in pricing by 10-40% across their entire portfolio of solutions, along with changes to their terms and conditions for the licensing of both commercial and non-profit based customers. 

So, where this would have normally only affected commercial organisations in the past, these changes are now going to also affect non-profit organisations for the first time in a while on a group of organisations who would have previously benefitted from Microsoft’s donation program.

First and foremost, before we create unnecessary panic, we need to make it clear that there are still benefits provided to non-profit based organisations.  But equally there are also changes that you will need to be aware of and will need to be considered from a budgeting perspective going forward.

Key points for non-profit based organisations to consider.

  • Any existing on premise or cloud license agreement will remain in place until it expires, or its annual anniversary (in relation to cloud-based subscriptions) is met.  Once expired or met your organisation will then fall within the new terms and conditions and a change of pricing will be implemented for any new agreements going forward.

  • Your organisation will no longer be able to avail of the usual donation-based licensing for on-premises based Microsoft software such as Windows Server, Microsoft SQL Server, and associated User/Devices CALS.   Previously organisations got this software as a donation and only paid a small administration fee from the distributor such as TechSoup or a Microsoft Partner authorised to sell non-profit based licensing and is extremely popular as a result.  However, come the March deadline, when an organisation wants to renew that software going forward, it will be at the commercial price with a discount of between 60-75% applied depending on the products required.  This will mean a considerable increase in cost for this type of license compared to previous years.  Although there will be exceptions and offers available in cases where computer labs, training rooms and public access computers are needed in organisations that qualify.

  • In addition, any Microsoft Cloud licensing (Office 365, Microsoft 365, and Dynamics 365) you may be using today will also have some form of price change applied once the anniversary date is met.  Fortunately, in most cases the price increment for these will be minimal and there will still be free tiers of licenses with limited functionality available.  The only considerations to consider here will be that these new tiers may offer less functionality than previous licensing.  So, a review of consumption and comparison of what functionality will be offered still needs to take place on a case-by-case basis to maximise the spend applied as much as possible.

  • However, any organisations currently using non-profit Microsoft Azure donation/credits of $3,500 (approx. £2,500) per annum to run cloud-based servers and associated services will still be able to continue to avail of this scheme unchanged.

So, what does this all mean for a non-profit based organisation going forward?

The highest cost increase will be for organisations that have a high usage of on-premises Microsoft licensing running their internal systems, especially those that utilise technologies such as Windows Server, Remote Desktop and Microsoft SQL Server.  Once those types of licenses become non-compliant and need to be renewed, the pricing will increase anything from 3-5 times more compared to the current donation programme method and will have a real impact on ICT budgeting.

In terms of cloud licensing, it is better news with more options available but the advice we would give initially is to review what cloud subscriptions are in use within the organisation before the annual anniversary date arrives.  Because on the start of the next year, a typical cloud subscription’s cost will increase from 10 to 40% per user, per month and if you do not review the rate of consumption, you will miss potential opportunities to keep cost increases minimised.  

What can my organisation do to minimise spending on Microsoft licensing?

So, as we’ve mentioned, costs for Microsoft licensing are going to increase.  Therefore, the first step to minimise cost is a perform a review of current usage and requirements.  In the past, our experience has shown there would tend to be an over allocation of licensing in the non-profit sector because the pricing was so low which ensured all usage was complaint but not applied efficiently because the costs were low.

Therefore, a more commercial focus will need to be adopted, reviewing what is used on premise and in cloud and selecting the most appropriate licensing and pricing offers that meets those needs in the best way.  For example, Microsoft will provide additional discounts on common cloud licensing if it is purchased up front for 12 months, compared to month-to-month based subscriptions.  However, that means the organisation must know the amount it intends to use in advance, hence the importance for a comprehensive review to be undertaken beforehand.  Also, free donation cloud licenses are still available, but some of the functionality has now changed and would need carefully compared before changes are made in an organisation.   

Finally, one of the main reasons organisations use on premise systems is compatibility with legacy line of business systems.  However, with the advancements in modern cloud platforms, these might be migratable to the cloud and the forthcoming license increases could then be seen as the opportunity for an organisation to make move to cloud which then adds additional benefits in business continuity and information security as cloud hosted solutions tend to offer, compared to running them on your own equipment on premise.  

For more information and assistance.

Endeavour is a leading multi gold competency Microsoft Partner with considerable experience assisting customers in managing its ICT systems and migrating them to cloud based platforms.  Their in-house Microsoft certified specialists can guide you through how these changes may impact the way you consume Microsoft licenses and will review how you can take full advantage of the forthcoming pricing increases, minimising costs and making the most of your ICT purchases.

You can contact the team to request a free, no commitment review of your current Microsoft licensing via email at solutions@endeavour-is.com or by calling Lee Surgeoner, Partner with Endeavour on 028 9031 1010.

Spooky But Very Tasty

With Halloween nearly upon us we’ve arranged with some help from Benningtons Cakes for some very tasty treats to be delivered to the office today. We suspect a number of disappearances will take place before too long, but doubt there will be any mystery as to why….

A big thank you to Karen and the team at Benningtons Cakes for providing us with lots of sugary goodness today! If this small sample has you wanting more, you can follow them on Instagram and their website.

Endeavour awarded fifth Microsoft Silver Competency

It’s been just over 3 months since my last update on our collection of Microsoft competencies but we’ve added a new one in the last few days.

Microsoft gold competencies are awarded to partners who demonstrate their technical excellence in, and best in class capability within, a Microsoft technology area.

Microsoft silver competencies are the stepping stones to a gold competencies and demonstrate consistent capability and commitment in a Microsoft solution area.

Endeavour now holds 8 Gold competencies and 5 Silver competencies, thanks to our team for attaining the required Microsoft Exams that are required to attain and retain these.

As a cloud-first focused Microsoft Partner we are extremely proud of our technical achievements and we hope that being awarded these competencies assures our current and future customers in our technical competence to deliver scalable solutions, deployed using a wide range of Microsoft cloud-based solutions that help meet compliance, replace complex and costly legacy systems and give them the necessary advantage in the current mobile-first, cloud-first world.

Microsoft Logo 2021-08-22.png

Endeavour awarded eighth Microsoft gold competency

I can’t believe that it has only been a month since the last post about our collection of Microsoft competencies!!!

We are delighted to announce that Endeavour has attained another gold competency from Microsoft!!!

Microsoft gold competencies are awarded to partners who demonstrate their technical excellence in Microsoft technology areas.

Thank you to our team for attaining the required Microsoft Exams that are required to attain this award.

Endeavour now holds 8 Gold competencies and 4 Silver competencies - what didn’t seem possible 10 months ago has now been achieved 2 months ahead of our target date, providing proof if ever it was needed that to attain a goal, you need to take the first step and keep moving forward at a steady pace.

As a cloud-first focused Microsoft Partner we are extremely proud of our technical achievements and we hope that being awarded these competencies assures our current and future customers in our technical competence to deliver scalable solutions, deployed using a wide range of Microsoft cloud-based solutions that help meet compliance, replace complex and costly legacy systems and give them the necessary advantage in the current mobile-first, cloud-first world.

Microsoft Logo 2021-05-07.png

Webinar Capabilities Being Added for all Microsoft Teams Users

As many of us continue to work from home and with many travel restrictions still in place, we’ve become used to attending webinars and other events virtually rather than attend in person. Starting this month, Microsoft is rolling out Teams webinar capabilities which includes a registration page with email confirmation for registrants, and reporting for registration and attendance.

Users with Office 365 or Microsoft 365 E3/E5/A3/A5/Business Standard/Business Premium will be entitled to these new capabilities and Microsoft are offering these capabilities for all other Teams users for the rest of 2021.

The rollout is due to be completed in May 2021, after which all Teams users will see an additional option when scheduling a meeting:

Picture1.png

Users will be able to add registrations for meetings and webinars outside of their own organization and this will be turned on by default for all users within the tenant, however this can be restricted in the Teams admin centre or with PowerShell commands.