Prescriptive Analytics – Outputs, levers and drivers

Welcome to the final part of our five part series on the Analytics Maturity Model. If you missed the last parts of this series, you can find them here.

Over the last number of weeks we have been exploring the Analytics Maturity Model. This is a roadmap for organisations to get to know their data and ultimately become insight driven. The stages of the journey are shown below. This week we are going to look at the last stage of the journey, Prescriptive Analytics, what are the elements you need to tweak to generate a certain outcome?

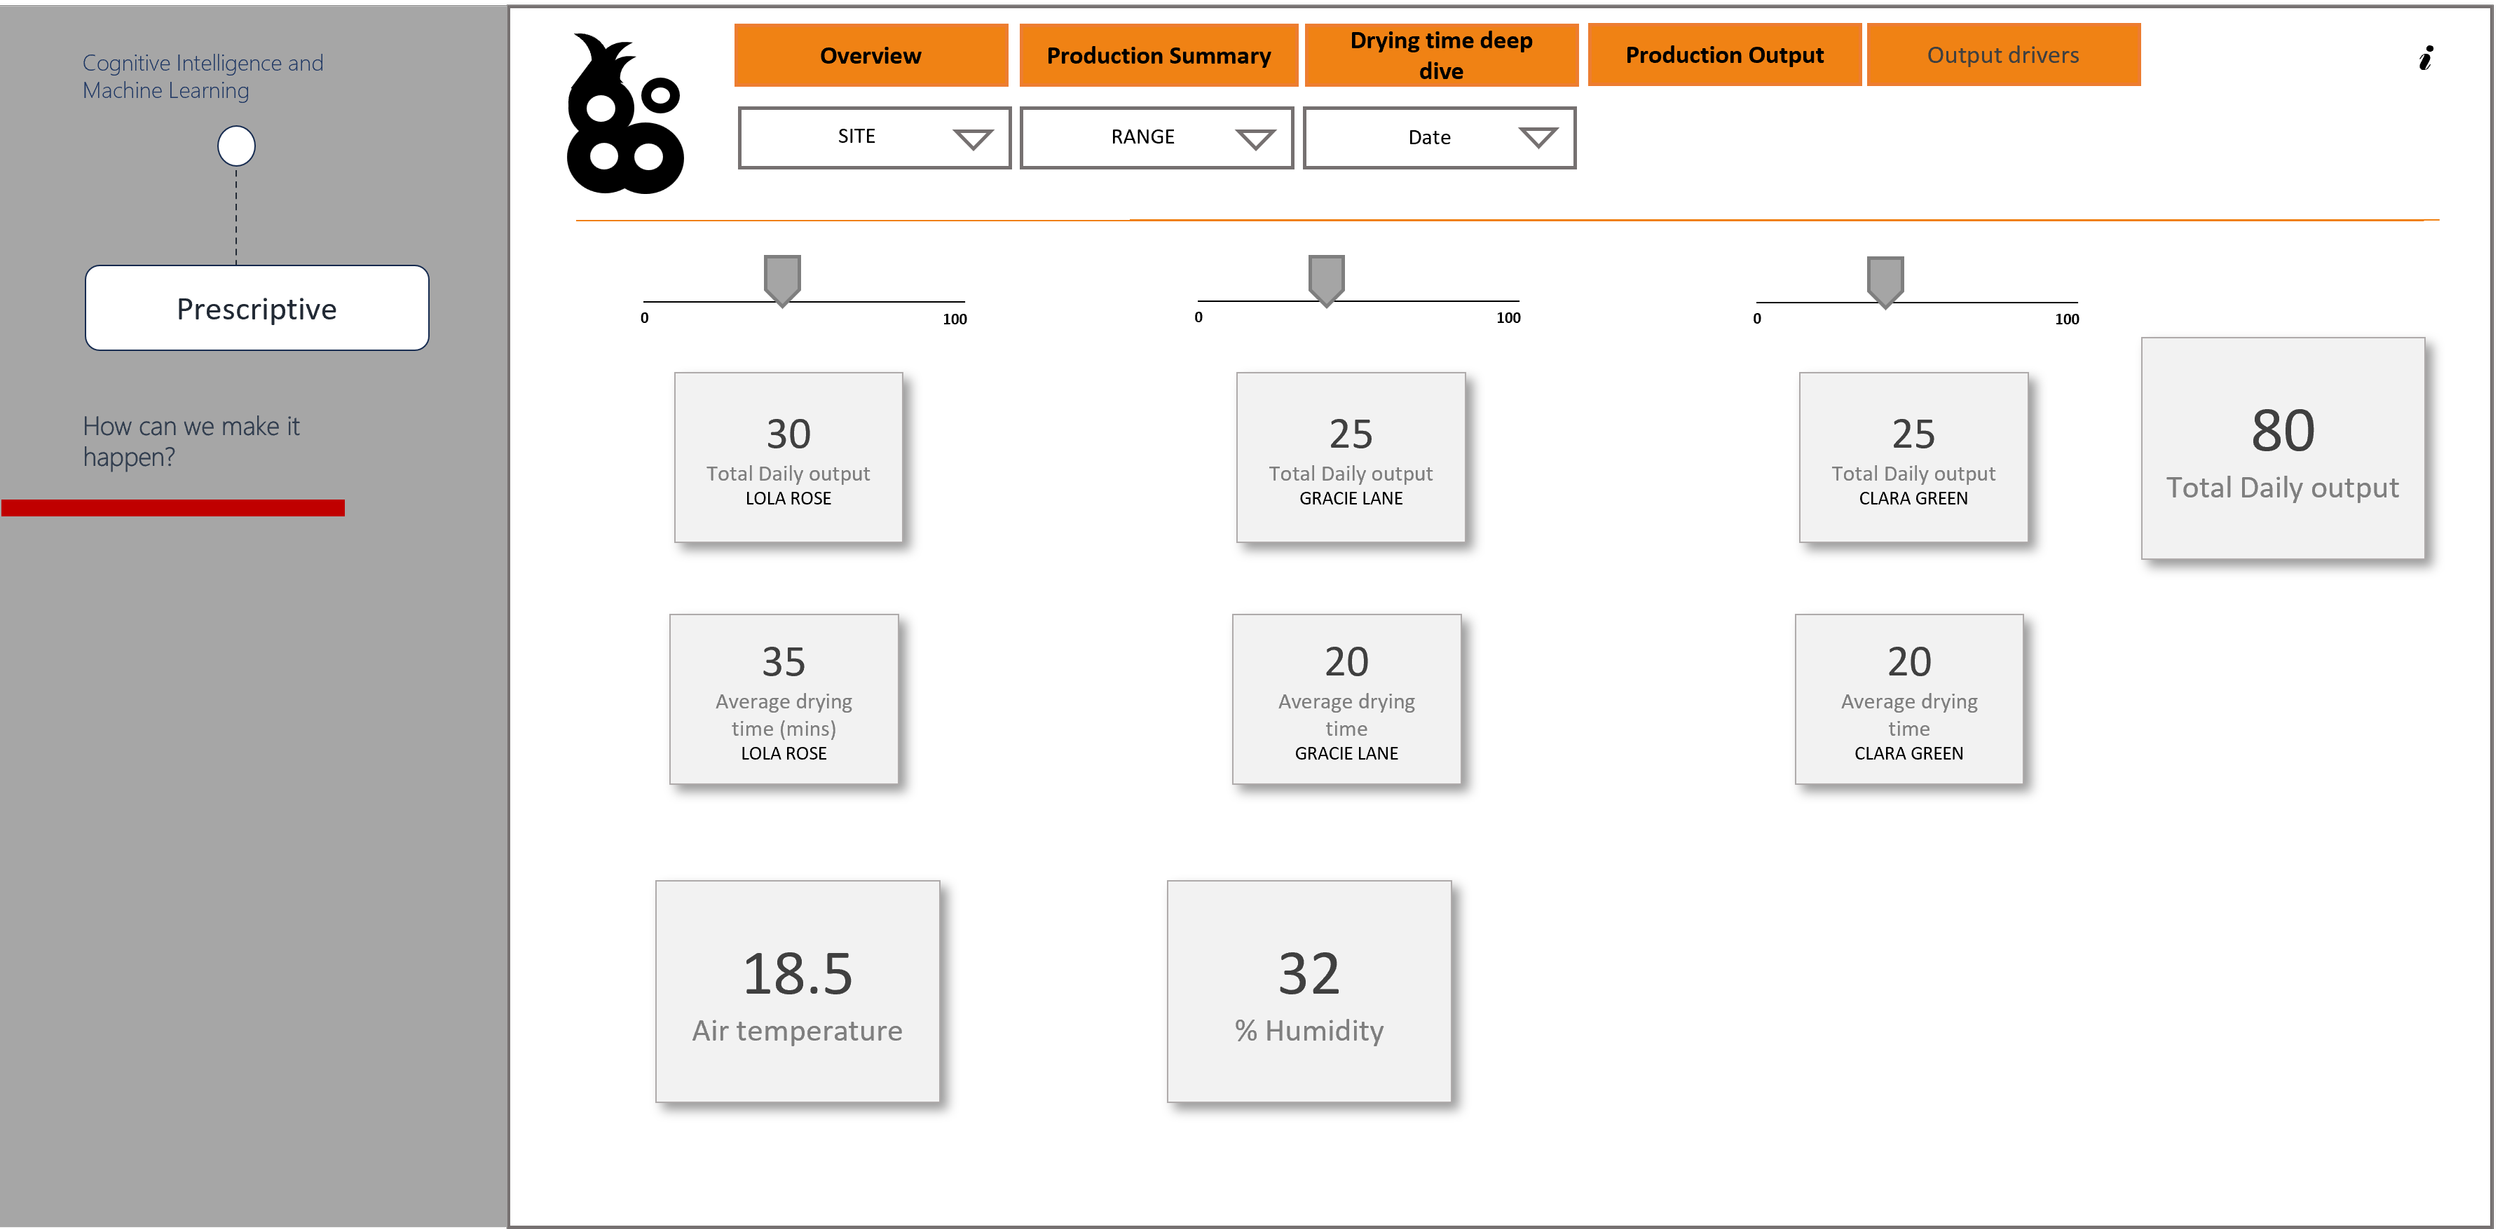
We have been following a manufacturing company on their analytics journey. They noticed that output was low on certain days, and have been working to find out the reasons behind it, and what they can do about it. They have started their journey by defining their metrics, captured their data, visualised it, identified the current issues, why they have happened and even predicted what will happen in the future depending on the weather conditions. What do they do with that information? They take action, but what action do they take? Again, organisations may know the answer to this anecdotally, but a prescriptive model will take all the data available and provide outcomes based on scenarios. I have often heard this described as ‘Outputs, levers and drivers’. Drivers are the factors in this example. In this case, materials and weather conditions, the two things that remain unchanged in the sense that they cannot be controlled. The levers are the elements that can be controlled, such as temperature and humidity, named as such as they can be controlled. The outputs are just that, they are the result of pulling the levers on the drivers, which in this case are drying times and production output.  

How does this work in practice? To get to this stage, a predictive model would need to be in place, it will predict outcomes and scenarios based on the data it has been fed, but the user will have the ability to tweak the scenario to find the best possible outcome, which will feed into the solution. Let’s look at this using our example; our company needs to know how to create the conditions to ensure that drying times are consistent across all materials, resulting in no change in production output, regardless of the weather conditions. Machine-learning algorithms will parse through data using ‘if’ and ‘else’ statements to explore scenarios and make recommendations. These recommendations are then verified by the production team, and strategies are put in place to ensure production is unaffected by the weather conditions. This is the perfect blend of technology and business knowledge.  The example below shows what this might look like. A Production Supervisor can use the toggles to select the desired output and the model advises what the desired air temperature and humidity should be.

Technology is amazing, but technology alone wouldn’t be half as impactful without the business knowledge to see it through to practical application. At Endeavour, we leverage the blend of technology and business knowledge. Our deep understanding of Microsoft technologies alongside the business application has proved invaluable to our clients, transforming their businesses and saving them money. We have worked with a number of organisations at varying stages of analytics maturity, providing services from infrastructure to AI whilst growing our own diverse business knowledge. We understand the challenges organisations face on the path to becoming insight driven. Data definitions can be difficult to align on. Knowing what infrastructure, you need in place to capture data efficiently and consistently while keeping costs low can be difficult to navigate. Adoption of new systems within an organisation can be difficult. Our experts at Endeavour are Microsoft certified along with several years of experience with organisations helping them navigate their analytics journeys. If you’re not sure how to get started on your analytics journey, why not get in touch with the team at Endeavour? We offer a free, no obligation consultation to help us get to know your organisation and help your understanding of what is involved in becoming insight driven. 

Predictive Analytics – Hindsight is a wonderful thing

Welcome to part four of our five part series, if you missed the last parts of this series, you can find them here.

Experience is so valuable in business. Much like our own expertise at Endeavour, the more clients we work with from different sectors and the more diverse the issues are, the more we grow our own expertise and can quickly identify solutions to clients. The more experience we have, the more knowledge we have. The exact same can be said for predictive analysis. No one can look into the future, but we can use our past experience to help navigate the impact of future events. COVID took us by surprise, we had never experienced a global pandemic to that degree. There was very little data available to help predict the impact of the devastation COVID caused. But with all the data gathered at the time and following, we will be better equipped to make decisions should another pandemic arise.  

Let’s go back to the example we have been using in this series. The Production Supervisor has come back to the Head of Production with a correlation between drying times and humidity, they have the hypothesis that on humid days, output is lower because drying times are slower as there is more moisture in the air. In order to test that hypothesis, data will have to be captured over time to understand what happens to production in certain weather conditions. This historical data can then be input into a predictive model which can be used to indicate the impact of weather conditions on production, which in turn can provide the business with the ability to take action on the days where humidity is high.  

So how does predictive analysis work in practice? It starts with a hypothesis, in this instance it’s; ‘humidity has an impact on production.’ The analysis needs to determine if weather conditions is a factor in production. The business will need data captured over time, this data will need to be cleaned and prepared to be fed into a predictive analytics model. Since we are looking at the relationship between variables, the data will be fed through a regression analysis model. If we wanted to look at this on an individual basis, i.e. by product, we might consider using a decision tree, as different materials might respond differently to weather conditions, therefore resulting in a different outcome. These models can be trained over time to add in more scenarios and for more accurate predictions as more data is captured.  

Predictive analytics has a number of uses, from fraud detection, operational improvement and customer segmentation. It is a very powerful tool, but it requires a strong foundation of accurate, well governed data capture, and a strong organisational culture of analytical best practices. Similar to how our bad experiences can make us biased, bad data and bad analytical practices can make predictive models biased. Our experts at Endeavour recognise these potential pitfalls when it comes to predictive models and work with our clients to ensure they have the correct foundations in place in order to get the most accurate predictions.  

Make sure to check back this time next week when we take the final step in our journey and look at Prescriptive Analytics.

Diagnostic Analytics – Context is Key

Welcome to part three of our five part series on the Analytics Maturity Model. If you missed the last parts of this series, you can find them here.

In this series we have been exploring the Analytics Maturity Model. The model details the various steps organisations go through to get to know their data better and ultimately become insight driven. Last week we looked at the ‘what happened’ through Descriptive Analytics and explored a potential scenario with a manufacturing company. This week we continue our journey and discover the ‘why’ behind the numbers.

Now that the organisation has established ‘what has happened’, it’s time to understand ‘why has it happened’ so that it can start to feed into the business decisions. In the previous article, I described a manufacturing company faced with the business question of; ‘why is output down?’. The business decided to investigate by capturing data on what was happening during the stages of production, as seemingly, nothing had changed from previous weeks. The first step was to look at the metrics they were capturing, apply the business logic and ensure that they were capturing the data in a consistent manner by using the correct tooling. By looking at all the production variables over the space of time, they were able to see that drying times were elevated on certain days which was having an impact on output. There is an insight, but what is the business action that can be taken on the back of that? Essentially, what is the ‘so what?’ This insight provides the first step to understanding the ‘so what’ and move into the diagnostic phase of ‘why is this happening?’.  

At this stage the collaboration of business knowledge and data is very powerful. That rich context that can provide an explanation as to why certain events are happening, backed up by accurate data can enable deeper understanding and empower organisations to make informed decisions. Tools like Power BI offer collaboration features, not just to share insights, but to provide business context through commentary. Power BI’s comment functionality allows users to discuss insights on the visuals. Let’s look at this in the context of our example. The Production Supervisor shares the visual that shows the correlation between low output and slower drying times with the Head of Production.  

The Head of Production advises the Production Supervisor investigates the drying conditions and overlay data on air temperature and humidity. Using the standards and methods applied in the previous steps to establish ‘what is happening’, the Production Supervisor can overlay data on air temperature and humidity to establish ‘why is this happening’. Since consistent data capture is now an established practice in the organisation, joining datasets is seamless. The Production Supervisor can join datasets together using Power BI Service to create a dashboard to layer on context. They discover that an increase in humidity is the potential cause of slower drying times, this is something that will need to be looked at over time to establish if this is a trend and what action should be taken. This comes later in the maturity journey.  

Last week I showed an example of what Descriptive Analytics might look like in a Power BI report. Below is an example of what a Power BI report could look like when we start to look at the ‘why’. We can clearly see the potential why alongside the slower drying times. On days where production is lower, air temperature is lower and humidity is higher.

Context is key, creating that fuller picture in data allows organisations to discover the reasons behind why certain events are happening and brings them closer to data driven decision making.  

Our experts at Endeavour have helped many organisations across numerous sectors bring their data together using Power BI to contextualise their insights, unlocking answers to complex business questions.  

Our journey continues this time next week, tune in to find out how the power of trends can help predict the future when we look at Predictive Analytics.

Descriptive Analytics – The first step to becoming insight driven

Welcome to part two of our five part series on the Analytics Maturity Model. If you missed the last part of this series, you can find it here.

Last week I introduced the Analytics Maturity Model which maps the stages of a company’s experience as they progress through a journey of understanding of their data. The model has four stages: Descriptive Analytics, what happened? Diagnostic Analytics, why has it happened? Predictive Analytics, what will happen? Prescriptive Analytics, how can we make it happen? This week we’re going to look at the first stage of this journey, Descriptive Analytics.

‘What happened?’ Simple question, right? No, not always. If there is no accurate data captured on an event, there is no way of knowing what happened. We may know anecdotally what happened based on experience, but small, but crucial details may go unacknowledged.  

Let’s look at a possible scenario; you own a company, you notice that output is lower than usual. All the variables that are measured are seemingly the same, materials, resources, timings, but for some reason, output is lower than usual. Why is this the case? It turns out with a closer investigation of timings by gathering accurate data on it that drying times are taking longer than usual. This has now highlighted an issue with drying times, which can be investigated further.  

So, what does that closer investigation look like? I said that timing is something that is measured. Timing is a metric, as it is something that needs to be measured to understand the production process, but what does timings mean to the organisation? This is where it is essential to understand from the business the exact definition of that metric. In this instance, one area of the business might have said that timing is not longer, as clear start and end points have not been defined, therefore no investigation pathway is opened and the low output may remain an issue for a long period of time. This could result in a loss of revenue and unsatisfied customers.  

Now that the metric definition is established, the next stage is looking to capture the data in an accurate and consistent way. This ensures that the correct foundations are laid in order to layer on that richer context to help discover why drying times were longer than before. So, in the example of our manufacturing company, in order to begin the investigation into the longer drying times, they first need to align on a number of things, at what stage does the drying process start? When does it end? Is drying time to be captured per item for the same item? What is the recommended drying time? These questions help define the metric and how it will be captured and calculated. It is a critical step in Descriptive Analytics. The image below shows what this might look like in a dashboard. We can see output, man hours and drying time, this dashboard describes what has happened in production.

Descriptive Analytics provides a narrative of events. It highlights the areas that need immediate attention. Therefore, it needs to be handled with care. That narrative needs to be the single source of truth. It needs to reflect the correct business logic. Alignment on definitions in the business is critical. The data capture needs to be accurate and consistent. Use of the correct tooling to capture data can help mitigate risk and error and ultimately ensure an output of reliable data.  

Metric definition and data capture is the first step, but data in its raw form is not very accessible. This is where tools like Power BI can help, by taking data from its source and transforming it into a readable format. So, when we go back to our example of the drying times, the Production Supervisor will be able to share a visual with the Head of Production that shows the correlation between drying times and lower output. The Head of Production will be able to look at this and advise on next steps.  

Descriptive Analytics provides a view of what happened. This alone can be very powerful as it gives 360° insight and signposts the areas of further investigation. At Endeavour, we help organisations explore the possibilities of analytics by empowering them to enrich their data with their expert business knowledge and help them get to know their data.  

This week we’ve look at the ‘what happened?’. Don’t forget to check in this time next week where I go to the next step of our journey and start to look at uncovering the ‘why’ behind our data through Diagnostic Analytics.

Analytics Maturity Model – Navigating your data journey

Welcome to the first of five articles on the Analytics Maturity Model.

Organisations will often say ‘I want to become more insight driven, but I don’t know where to start.’ Like any journey, it starts with the first step. Not necessarily where are you stepping to, but where you are stepping from. That will determine what the rest of the journey looks like.  

What is the benefit of being insight driven? ‘It’s always been done that way’ is a popular justification for some of the business-critical decisions, but what is the danger of this? Organisations know their businesses inside out, but what if there was a way for them to have a clearer view of what is happening? Why is it happening? What might happen in the future? and how to control what will happen in the future? Sometimes there are blind spots, areas where efficiencies can be made that go unnoticed, but they might be having a massive impact on the bottom line. Having a 360° view has been proven to reap massive benefits for organisations.  

Often organisations can face issues such as a lack of the correct infrastructure needed to capture and analyse data correctly. This is seemingly a costly exercise, however the cost of not investing in analytics can far exceed the cost of investment in infrastructure.  

The Analytics Maturity Model maps out what the journey to becoming insight driven looks like. At Endeavour, we know that journey is unique to every business, but this is the broad model to helping organisations become empowered to make more complex business decisions.  

The Analytics Maturity model showing the four stages of the model. Descriptive Analytics, Diagnostic Analytics, Predictive Analytics and Prescriptive Analytics.

The first step in any organisations analytical journey is working out ‘what happened?’. An example of this is ‘what were my sales this week?’ This provides the core foundation to understanding where the fires are, what needs immediate attention? This stage is around understanding your data, therefore it requires the most care when setting up your data capture methods, aligning on metrics and establishing their definition. This solid foundation of analytical best practice allows for adding the next layer of analysis and help organisations to understand ‘why did this happen?’ Are there any trends? What is the wider context? So, ‘why were my sales low this week?’ This can only be achieved with the right foundation in place. Ensuring that sales data is captured correctly and the definition of ‘sales’ is defined. The next layer to this is understanding ‘what will happen’, when organisations have a view of certain trends, i.e. what is the potential impact on sales during adverse weather? Having historical sales data alongside weather statistics allows a view of a correlation between the two metrics, this in turn can give a view of what might happen to sales in a storm, or in a heatwave and allow stock levels to be adjusted accordingly to avoid waste. That leads to the next layer of how much I need to adjust stock levels by to ensure waste is minimised depending on the weather conditions.  

At Endeavour, we have helped numerous organisations at varying stages of their analytics Journey. We understand the value of the rich industry and business knowledge when it comes to laying the foundation of the pathway to become insight driven. We collaborate with organisations to embed that knowledge at the heart of business decisions alongside accurate and meaningful data.  

Join me this time next week, when I’ll be taking you on the first step of the Analytics Maturity Model journey by diving into Descriptive Analytics and looking at how it can be applied to a real life example.