
Diagnostic Analytics – Context is Key
/Welcome to part three of our five part series on the Analytics Maturity Model. If you missed the last parts of this series, you can find them here.
In this series we have been exploring the Analytics Maturity Model. The model details the various steps organisations go through to get to know their data better and ultimately become insight driven. Last week we looked at the ‘what happened’ through Descriptive Analytics and explored a potential scenario with a manufacturing company. This week we continue our journey and discover the ‘why’ behind the numbers.
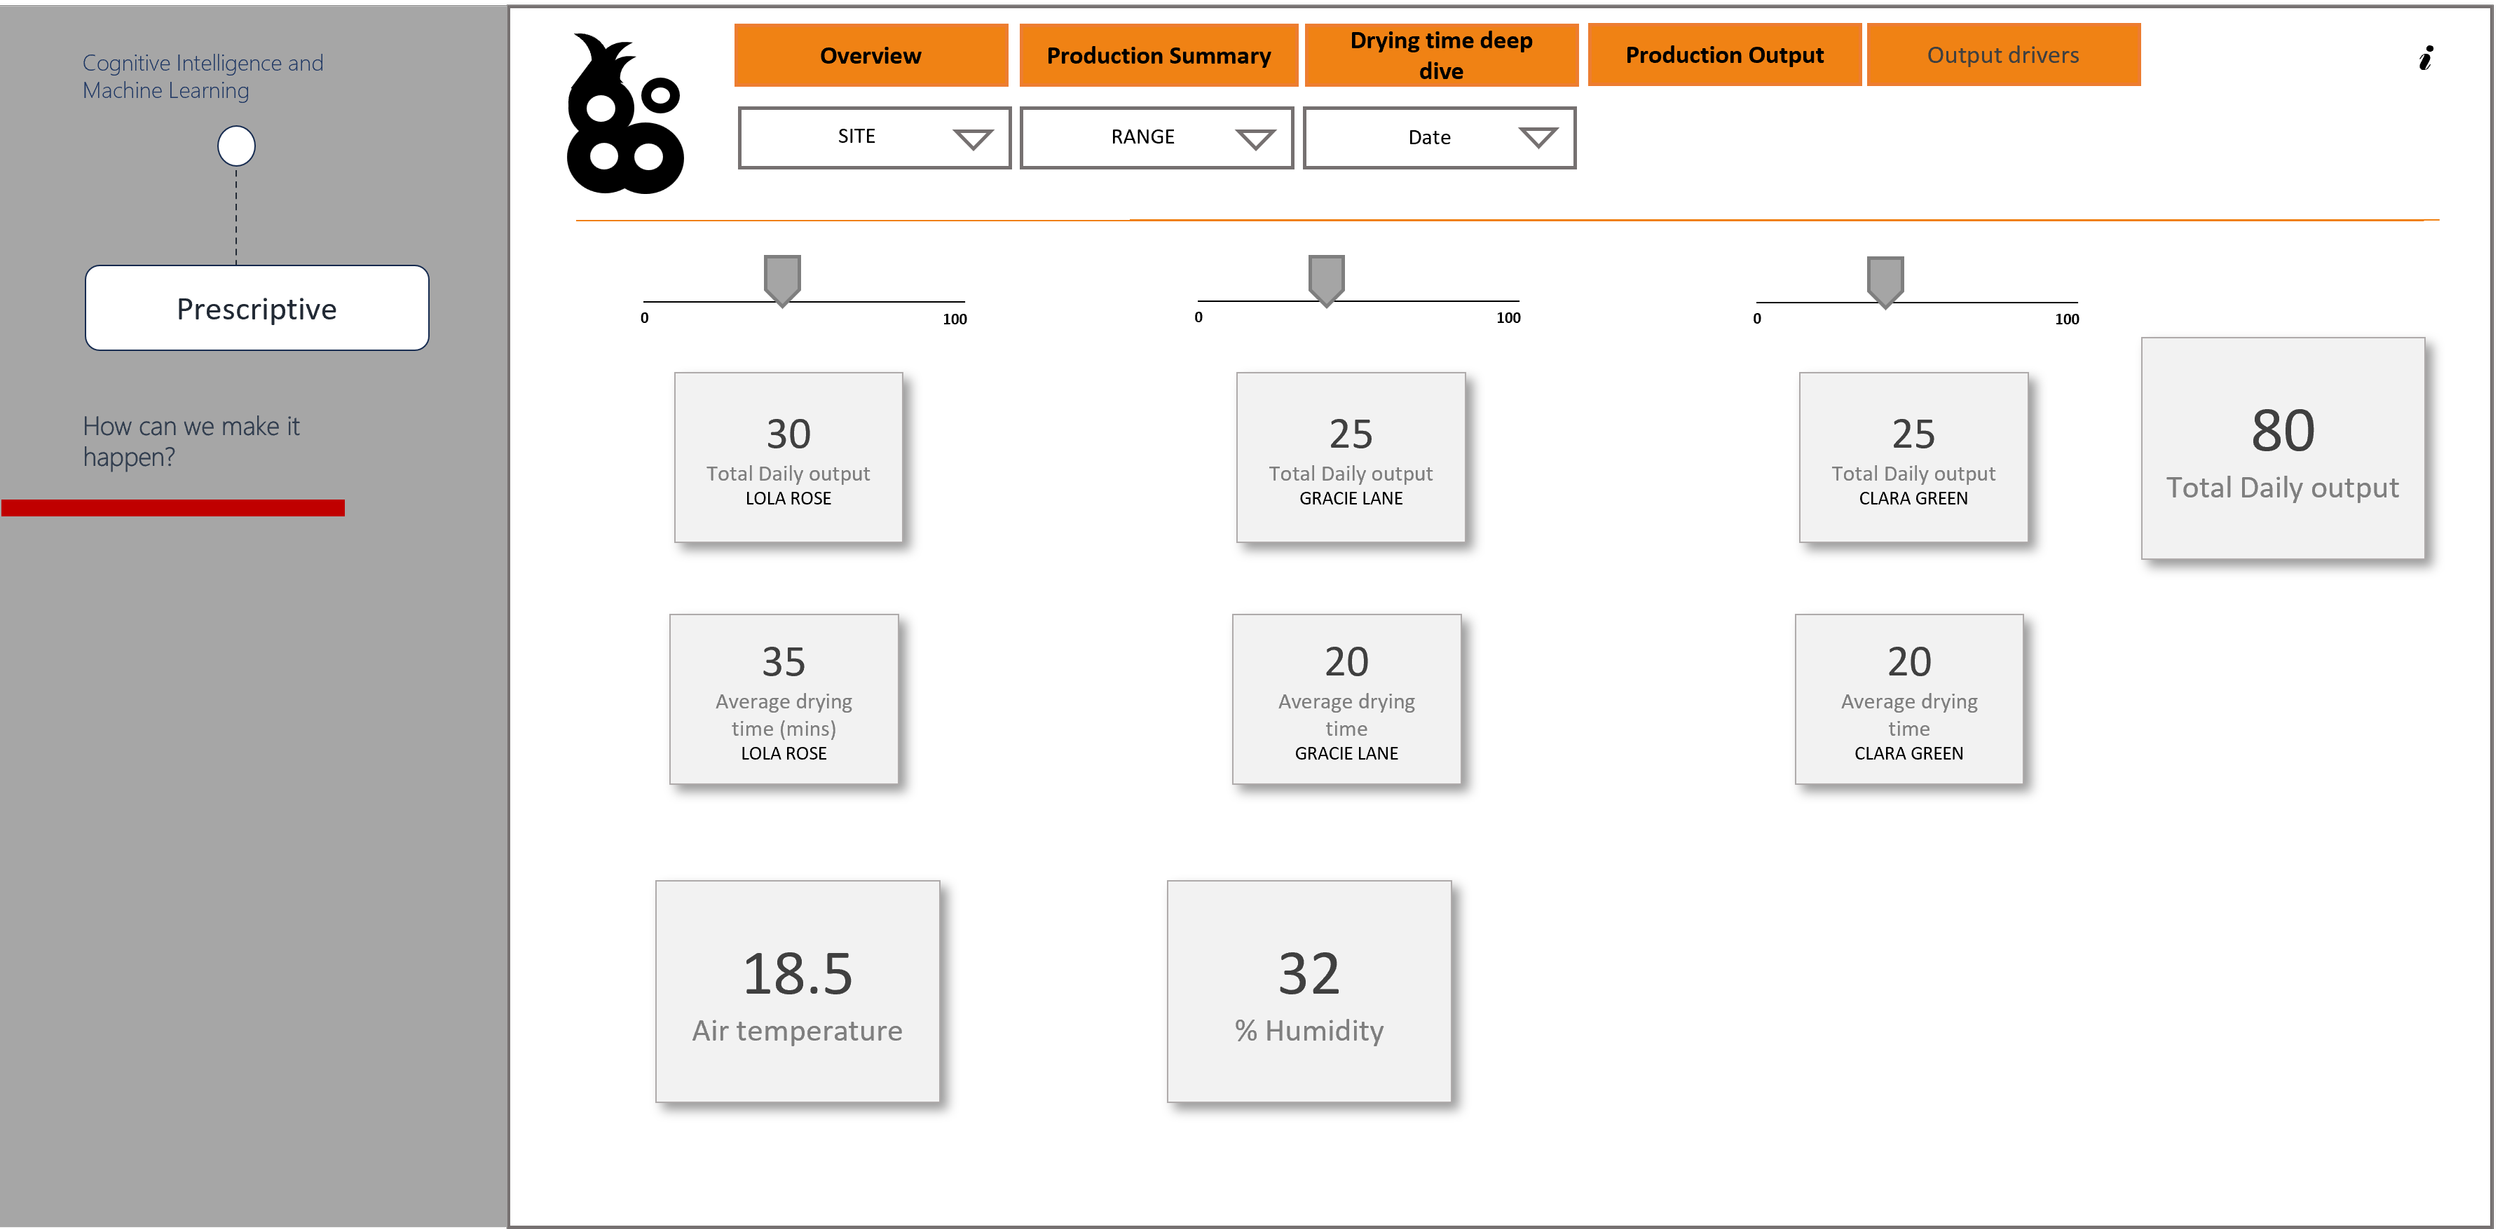
Now that the organisation has established ‘what has happened’, it’s time to understand ‘why has it happened’ so that it can start to feed into the business decisions. In the previous article, I described a manufacturing company faced with the business question of; ‘why is output down?’. The business decided to investigate by capturing data on what was happening during the stages of production, as seemingly, nothing had changed from previous weeks. The first step was to look at the metrics they were capturing, apply the business logic and ensure that they were capturing the data in a consistent manner by using the correct tooling. By looking at all the production variables over the space of time, they were able to see that drying times were elevated on certain days which was having an impact on output. There is an insight, but what is the business action that can be taken on the back of that? Essentially, what is the ‘so what?’ This insight provides the first step to understanding the ‘so what’ and move into the diagnostic phase of ‘why is this happening?’.
At this stage the collaboration of business knowledge and data is very powerful. That rich context that can provide an explanation as to why certain events are happening, backed up by accurate data can enable deeper understanding and empower organisations to make informed decisions. Tools like Power BI offer collaboration features, not just to share insights, but to provide business context through commentary. Power BI’s comment functionality allows users to discuss insights on the visuals. Let’s look at this in the context of our example. The Production Supervisor shares the visual that shows the correlation between low output and slower drying times with the Head of Production.
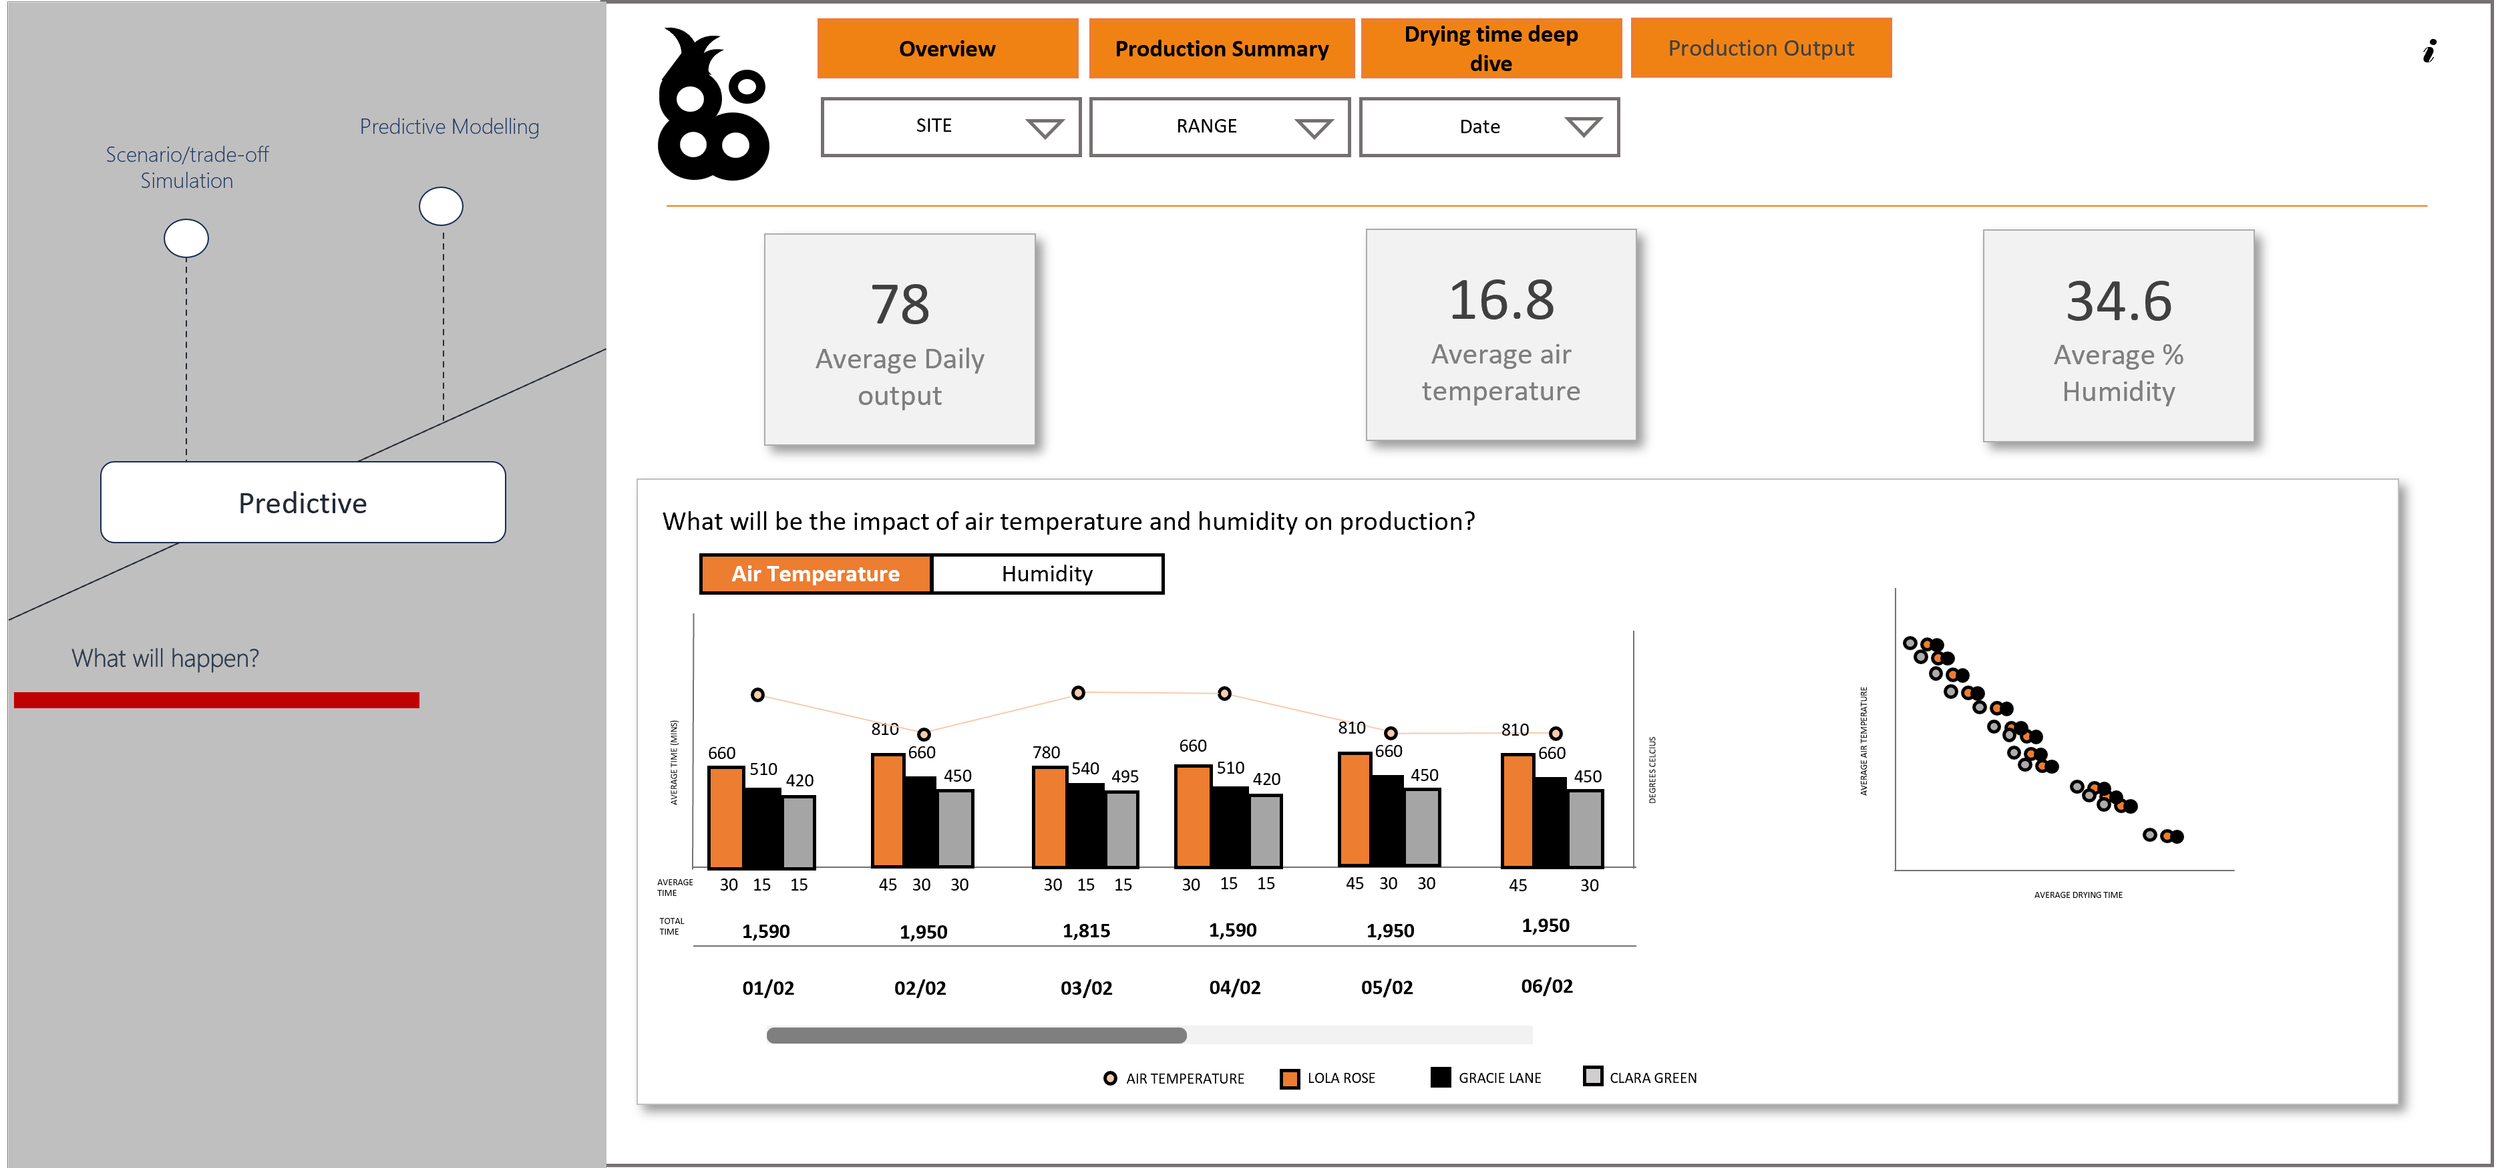
The Head of Production advises the Production Supervisor investigates the drying conditions and overlay data on air temperature and humidity. Using the standards and methods applied in the previous steps to establish ‘what is happening’, the Production Supervisor can overlay data on air temperature and humidity to establish ‘why is this happening’. Since consistent data capture is now an established practice in the organisation, joining datasets is seamless. The Production Supervisor can join datasets together using Power BI Service to create a dashboard to layer on context. They discover that an increase in humidity is the potential cause of slower drying times, this is something that will need to be looked at over time to establish if this is a trend and what action should be taken. This comes later in the maturity journey.
Last week I showed an example of what Descriptive Analytics might look like in a Power BI report. Below is an example of what a Power BI report could look like when we start to look at the ‘why’. We can clearly see the potential why alongside the slower drying times. On days where production is lower, air temperature is lower and humidity is higher.

Context is key, creating that fuller picture in data allows organisations to discover the reasons behind why certain events are happening and brings them closer to data driven decision making.
Our experts at Endeavour have helped many organisations across numerous sectors bring their data together using Power BI to contextualise their insights, unlocking answers to complex business questions.
Our journey continues this time next week, tune in to find out how the power of trends can help predict the future when we look at Predictive Analytics.